Abbott Laboratories Technical Analysis


As of date:4/24/2024
ABT stock price:106.89
ABT 50 DMA:113.39
ABT 200 DMA:105.65
ABT MACD (200-50):-7.74
ABT RSI:41.07
Extremely
Overbought
Overbought/Oversold RSI Range
RSI Indicator (Relative Strength Index)41.07
Extremely
Oversold

Also see:
ABT Market Cap History
ABT Shares Outstanding History
ABT YTD Return

Quotes delayed 20 minutes

Email EnvelopeFree ABT Email Alerts:
Get Dividend Alerts
Get SEC Filing Alerts

Coastal Financial Breaks Above 200-Day Moving Average - Bullish for CCB
1 hour, 18 minutes ago


CNOB Makes Bullish Cross Above Critical Moving Average
1 hour, 19 minutes ago


Bullish Two Hundred Day Moving Average Cross - MDLZ
1 hour, 21 minutes ago


ATXS Makes Notable Cross Below Critical Moving Average
1 hour, 22 minutes ago


United States Steel Breaks Below 200-Day Moving Average - Notable for X
1 hour, 26 minutes ago


Boyd Group Services Crosses Below Key Moving Average Level
2 hours, 9 minutes ago


Notable Two Hundred Day Moving Average Cross - BVS
5 hours, 45 minutes ago


LOVE Crosses Above Key Moving Average Level
5 hours, 45 minutes ago


AUTL Makes Notable Cross Below Critical Moving Average
5 hours, 45 minutes ago


BILI Crosses Above Key Moving Average Level
5 hours, 46 minutes ago


KalVista Pharmaceuticals Breaks Below 200-Day Moving Average - Notable for KALV
5 hours, 46 minutes ago


OCUL Makes Notable Cross Below Critical Moving Average
5 hours, 46 minutes ago


United Community Banks Breaks Above 200-Day Moving Average - Bullish for UCBI
5 hours, 50 minutes ago


FMNB Makes Bullish Cross Above Critical Moving Average
5 hours, 51 minutes ago


Notable Two Hundred Day Moving Average Cross - MANH
6 hours, 28 minutes ago


More Technical Analysis News

ABT Technical AnalysisABT RSI
Abbott Laboratories is engaged in the discovery, development, manufacture, and sale of a line of health care products. Co. has four segments: Established Pharmaceutical Products, which includes a line of generic pharmaceuticals; Diagnostic Products, which includes a line of diagnostic systems and tests; Nutritional Products, which includes a line of pediatric and adult nutritional products; and Medical Devices, which includes a line of rhythm management, electrophysiology, heart failure, vascular and structural heart devices for the treatment of cardiovascular diseases, and diabetes care products, as well as neuromodulation devices for the management of chronic pain and movement disorders.

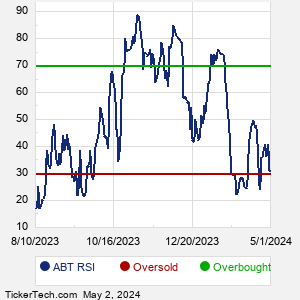
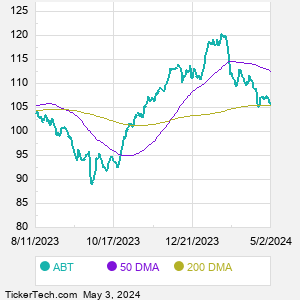
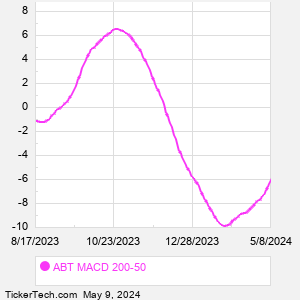
When researching a stock like Abbott Laboratories, many investors are the most familiar with Fundamental Analysis — looking at a company's balance sheet, earnings, revenues, and what's happening in that company's underlying business. Investors who use Fundamental Analysis to identify good stocks to buy or sell can also benefit from ABT Technical Analysis to help find a good entry or exit point. Technical Analysis is blind to the fundamentals and looks only at the trading data for ABT stock — the real life supply and demand for the stock over time — and examines that data in different ways.
10 Most Oversold S&P 500 Stocks
10 Most Overbought S&P 500 Stocks

10 ETFs With Stocks Insiders Are Buying
10 ETFs With Most Upside To Targets
The DividendRank Top 25
Warren Buffett Dividend Stocks
10 Cheap Dividend Stocks Under $10
10 Top DividendRank'ed Energy Stocks
The 10 Highest Yielding Preferred Stocks
The 15 Most Active S&P Call & Put Options
ABT DMAABT MACD
Video: Technical Analysis


If the video does not load after a few moments, Upgrade to the Latest Flash Player.
Abbott Laboratories (ABT) is categorized under the Healthcare sector; to help you further research Technical Analysis, below are some other companies in the same sector:

ALGN Technical Analysis
AMGN Technical Analysis
BAX Technical Analysis
BDX Technical Analysis
BIIB Technical Analysis
BIO Technical Analysis
BMY Technical Analysis
BSX Technical Analysis
CAH Technical Analysis
CI Technical Analysis
More Healthcare companies »


Abbott Laboratories Technical Analysis | www.TechnicalAnalysisChannel.com | Copyright © 2019 - 2024, All Rights Reserved

Nothing in TechnicalAnalysisChannel.com is intended to be investment advice, nor does it represent the opinion of, counsel from, or recommendations by BNK Invest Inc. or any of its affiliates, subsidiaries or partners. None of the information contained herein constitutes a recommendation that any particular security, portfolio, transaction, or investment strategy is suitable for any specific person. All viewers agree that under no circumstances will BNK Invest, Inc,. its subsidiaries, partners, officers, employees, affiliates, or agents be held liable for any loss or damage caused by your reliance on information obtained. By visiting, using or viewing this site, you agree to the following Full Disclaimer & Terms of Use and Privacy Policy. Video widget and market videos powered by Market News Video. Quote and option data delayed at least 15 minutes; stock quote data powered by Ticker Technologies, and Mergent.
X
Wait! Don't leave yet.
Want to receive our latest research absolutely free?


Click the button below for your complimentary copy of Your Early Retirement Portfolio: Dividends Up to 8.7%—Every Month—Forever.

You'll discover the details on 4 stocks and funds that pay you massive dividends as high as 8.7%.