AMCR Technical Analysis


As of date:4/17/2024
AMCR stock price:8.83
AMCR 50 DMA:9.17
AMCR 200 DMA:9.19
AMCR MACD (200-50):0.02
AMCR RSI:25.19
Extremely
Overbought
Overbought/Oversold RSI Range
RSI Indicator (Relative Strength Index)25.19
Extremely
Oversold

Also see:
AMCR Market Cap History
AMCR Shares Outstanding History
AMCR YTD Return

Quotes delayed 20 minutes

Email EnvelopeFree AMCR Email Alerts:
Get Dividend Alerts
Get SEC Filing Alerts
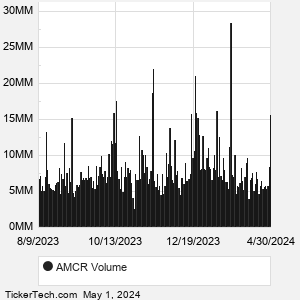
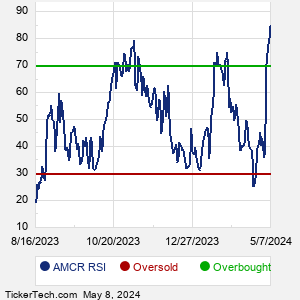
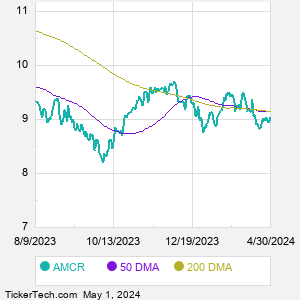
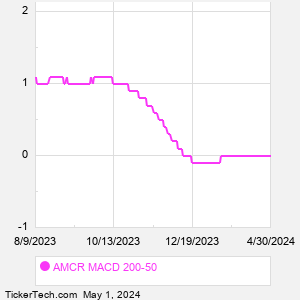
Phreesia (PHR) Shares Cross Below 200 DMA
6 minutes ago


Hope Bancorp Shares Cross Below 200 DMA
10 minutes ago


TXN Crosses Below Key Moving Average Level
14 minutes ago


Monarch Casino & Resort (MCRI) Shares Cross Below 200 DMA
14 minutes ago


NSP Makes Bullish Cross Above Critical Moving Average
16 minutes ago


CVI Makes Notable Cross Below Critical Moving Average
21 minutes ago


SNA Crosses Below Key Moving Average Level
38 minutes ago


Waters (WAT) Shares Cross Below 200 DMA
40 minutes ago


FIVG Crosses Critical Technical Indicator
40 minutes ago


TMFG Getting Very Oversold
40 minutes ago


Bullish Two Hundred Day Moving Average Cross - FDP
40 minutes ago


MKC Makes Bullish Cross Above Critical Moving Average
44 minutes ago


ZYME Crosses Below Key Moving Average Level
18 hours, 54 minutes ago


WVE Crosses Below Key Moving Average Level
18 hours, 54 minutes ago


Notable Two Hundred Day Moving Average Cross - SUPN
18 hours, 59 minutes ago


More Technical Analysis News

AMCR Technical AnalysisAMCR RSI
Amcor is engaged in developing and producing packaging for food, beverage, pharmaceutical, medical, home and personal-care, and other products. Co.'s reportable segments are: Flexibles and Rigid Packaging. Co.'s Flexibles Segment develops and supplies flexible packaging. The Flexibles Segment is a supplier of plastic, aluminum, and fiber based flexible packaging. Co.'s Rigid Packaging Segment manufactures rigid packaging containers and related products in the Americas. Co.'s sales are made through a variety of distribution channels, but through its direct sales force. Sales offices and plants are located throughout Europe, North America, Latin America, Africa, and Asia-Pacific regions.

When researching a stock like Amcor, many investors are the most familiar with Fundamental Analysis — looking at a company's balance sheet, earnings, revenues, and what's happening in that company's underlying business. Investors who use Fundamental Analysis to identify good stocks to buy or sell can also benefit from AMCR Technical Analysis to help find a good entry or exit point. Technical Analysis is blind to the fundamentals and looks only at the trading data for AMCR stock — the real life supply and demand for the stock over time — and examines that data in different ways.
10 Most Oversold S&P 500 Stocks
10 Most Overbought S&P 500 Stocks

10 ETFs With Stocks Insiders Are Buying
10 ETFs With Most Upside To Targets
The DividendRank Top 25
Warren Buffett Dividend Stocks
10 Cheap Dividend Stocks Under $10
10 Top DividendRank'ed Energy Stocks
The 10 Highest Yielding Preferred Stocks
The 15 Most Active S&P Call & Put Options
AMCR DMAAMCR MACD
Video: Technical Analysis


If the video does not load after a few moments, Upgrade to the Latest Flash Player.
 

AMCR Technical Analysis | www.TechnicalAnalysisChannel.com | Copyright © 2019 - 2024, All Rights Reserved

Nothing in TechnicalAnalysisChannel.com is intended to be investment advice, nor does it represent the opinion of, counsel from, or recommendations by BNK Invest Inc. or any of its affiliates, subsidiaries or partners. None of the information contained herein constitutes a recommendation that any particular security, portfolio, transaction, or investment strategy is suitable for any specific person. All viewers agree that under no circumstances will BNK Invest, Inc,. its subsidiaries, partners, officers, employees, affiliates, or agents be held liable for any loss or damage caused by your reliance on information obtained. By visiting, using or viewing this site, you agree to the following Full Disclaimer & Terms of Use and Privacy Policy. Video widget and market videos powered by Market News Video. Quote and option data delayed at least 15 minutes; stock quote data powered by Ticker Technologies, and Mergent.
X
Wait! Don't leave yet.
Want to receive our latest research absolutely free?


Click the button below for your complimentary copy of Your Early Retirement Portfolio: Dividends Up to 8.7%—Every Month—Forever.

You'll discover the details on 4 stocks and funds that pay you massive dividends as high as 8.7%.