BBY Technical Analysis


As of date:4/17/2024
BBY stock price:76.23
BBY 50 DMA:77.26
BBY 200 DMA:73.27
BBY MACD (200-50):-3.99
BBY RSI:31.71
Extremely
Overbought
Overbought/Oversold RSI Range
RSI Indicator (Relative Strength Index)31.71
Extremely
Oversold

Also see:
BBY Market Cap History
BBY Shares Outstanding History
BBY YTD Return

Quotes delayed 20 minutes

Email EnvelopeFree BBY Email Alerts:
Get Dividend Alerts
Get SEC Filing Alerts

Academy Sports & Outdoors Breaks Below 200-Day Moving Average - Notable for ASO
3 hours, 21 minutes ago


Triumph Financial Breaks Below 200-Day Moving Average - Notable for TFIN
3 hours, 22 minutes ago


Phreesia (PHR) Shares Cross Below 200 DMA
3 hours, 36 minutes ago


Hope Bancorp Shares Cross Below 200 DMA
3 hours, 40 minutes ago


TXN Crosses Below Key Moving Average Level
3 hours, 44 minutes ago


Monarch Casino & Resort (MCRI) Shares Cross Below 200 DMA
3 hours, 44 minutes ago


NSP Makes Bullish Cross Above Critical Moving Average
3 hours, 46 minutes ago


CVI Makes Notable Cross Below Critical Moving Average
3 hours, 51 minutes ago


SNA Crosses Below Key Moving Average Level
4 hours, 8 minutes ago


Waters (WAT) Shares Cross Below 200 DMA
4 hours, 10 minutes ago


FIVG Crosses Critical Technical Indicator
4 hours, 10 minutes ago


TMFG Getting Very Oversold
4 hours, 10 minutes ago


Bullish Two Hundred Day Moving Average Cross - FDP
4 hours, 10 minutes ago


MKC Makes Bullish Cross Above Critical Moving Average
4 hours, 14 minutes ago


ZYME Crosses Below Key Moving Average Level
22 hours, 24 minutes ago


More Technical Analysis News

BBY Technical AnalysisBBY RSI
Best Buy is a technology retailer. Co. has two segments: Domestic and International. The Domestic segment is comprised of the its operations in all states, districts and territories of the U.S. and its Best Buy Health business, and includes the brand names Best Buy, Best Buy Ads, Best Buy Business, Best Buy Health, CST, Current Health, Geek Squad, Lively, Magnolia, Pacific Kitchen and Home, TechLiquidators and Yardbird and the domain names bestbuy.com, currenthealth.com, lively.com, techliquidators.com and yardbird.com. Co.'s International segment is comprised of all operations in Canada under the brand names Best Buy, Best Buy Mobile and Geek Squad and the domain name bestbuy.ca.

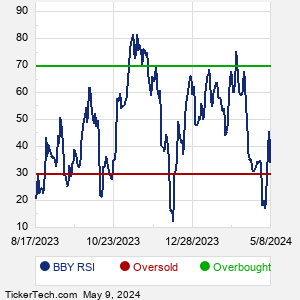
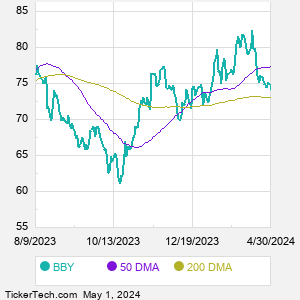
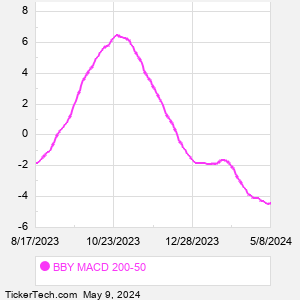
When researching a stock like Best Buy, many investors are the most familiar with Fundamental Analysis — looking at a company's balance sheet, earnings, revenues, and what's happening in that company's underlying business. Investors who use Fundamental Analysis to identify good stocks to buy or sell can also benefit from BBY Technical Analysis to help find a good entry or exit point. Technical Analysis is blind to the fundamentals and looks only at the trading data for BBY stock — the real life supply and demand for the stock over time — and examines that data in different ways.
10 Most Oversold S&P 500 Stocks
10 Most Overbought S&P 500 Stocks

10 ETFs With Stocks Insiders Are Buying
10 ETFs With Most Upside To Targets
The DividendRank Top 25
Warren Buffett Dividend Stocks
10 Cheap Dividend Stocks Under $10
10 Top DividendRank'ed Energy Stocks
The 10 Highest Yielding Preferred Stocks
The 15 Most Active S&P Call & Put Options
BBY DMABBY MACD
Video: Technical Analysis


If the video does not load after a few moments, Upgrade to the Latest Flash Player.
Best Buy (BBY) is categorized under the Services sector; to help you further research Technical Analysis, below are some other companies in the same sector:

BKNG Technical Analysis
CCL Technical Analysis
CHTR Technical Analysis
CMCSA Technical Analysis
CMG Technical Analysis
COST Technical Analysis
CZR Technical Analysis
DG Technical Analysis
DHI Technical Analysis
DIS Technical Analysis
More Services companies »


BBY Technical Analysis | www.TechnicalAnalysisChannel.com | Copyright © 2019 - 2024, All Rights Reserved

Nothing in TechnicalAnalysisChannel.com is intended to be investment advice, nor does it represent the opinion of, counsel from, or recommendations by BNK Invest Inc. or any of its affiliates, subsidiaries or partners. None of the information contained herein constitutes a recommendation that any particular security, portfolio, transaction, or investment strategy is suitable for any specific person. All viewers agree that under no circumstances will BNK Invest, Inc,. its subsidiaries, partners, officers, employees, affiliates, or agents be held liable for any loss or damage caused by your reliance on information obtained. By visiting, using or viewing this site, you agree to the following Full Disclaimer & Terms of Use and Privacy Policy. Video widget and market videos powered by Market News Video. Quote and option data delayed at least 15 minutes; stock quote data powered by Ticker Technologies, and Mergent.
X
Wait! Don't leave yet.
Want to receive our latest research absolutely free?


Click the button below for your complimentary copy of Your Early Retirement Portfolio: Dividends Up to 8.7%—Every Month—Forever.

You'll discover the details on 4 stocks and funds that pay you massive dividends as high as 8.7%.