BK Technical Analysis


As of date:1/23/2025
BK stock price:84.73
BK 50 DMA:79.20
BK 200 DMA:67.68
BK MACD (200-50):-11.52
BK RSI:75.52
Extremely
Overbought
Overbought/Oversold RSI Range
RSI Indicator (Relative Strength Index)75.52
Extremely
Oversold

Also see:
BK Market Cap History
BK Shares Outstanding History
BK YTD Return

Quotes delayed 20 minutes

Email EnvelopeFree BK Email Alerts:
Get Dividend Alerts
Get SEC Filing Alerts

Bullish Two Hundred Day Moving Average Cross - GBDC
1 hour, 13 minutes ago


Bullish Two Hundred Day Moving Average Cross - LOCO
1 hour, 14 minutes ago


MSBI Crosses Below Key Moving Average Level
1 hour, 15 minutes ago


PARA Crosses Above Key Moving Average Level
1 hour, 21 minutes ago


DJCO Crosses Below Key Moving Average Level
1 hour, 33 minutes ago


Riskified Ltd Breaks Above 200-Day Moving Average - Bullish for RSKD
1 hour, 38 minutes ago


IBTH Makes Bullish Cross Above Critical Moving Average
1 hour, 38 minutes ago


Vanguard International High Dividend Yield Breaks Above 200-Day Moving Average - Bullish for VYMI
1 hour, 38 minutes ago


Bullish Two Hundred Day Moving Average Cross - EEMA
1 hour, 38 minutes ago


Notable Two Hundred Day Moving Average Cross - GRNT
1 hour, 38 minutes ago


MFDX Crosses Above Key Moving Average Level
1 hour, 57 minutes ago


Bullish Two Hundred Day Moving Average Cross - INTF
1 hour, 57 minutes ago


Bullish Two Hundred Day Moving Average Cross - EMQQ
1 hour, 57 minutes ago


Bullish Two Hundred Day Moving Average Cross - CWEB
1 hour, 57 minutes ago


iShares iBonds Dec 2028 Term Corporate (IBDT) Shares Cross Above 200 DMA
1 hour, 57 minutes ago


More Technical Analysis News

BK Technical AnalysisBK RSI
The Bank of New York Mellon Corporation is a global company. Co.'s businesses are divided into three business segments: Securities Services, Market and Wealth Services and Investment and Wealth Management. Co. also includes Other segment, which includes the leasing portfolio, corporate treasury activities, including its securities portfolio, derivatives and other trading activities, corporate and bank-owned life insurance, renewable energy and other corporate investments.

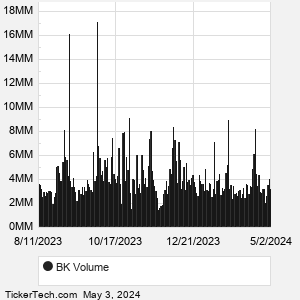
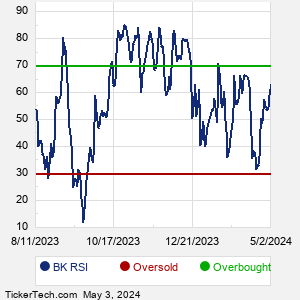
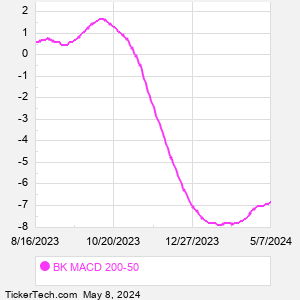
When researching a stock like Bank of York Mellon, many investors are the most familiar with Fundamental Analysis — looking at a company's balance sheet, earnings, revenues, and what's happening in that company's underlying business. Investors who use Fundamental Analysis to identify good stocks to buy or sell can also benefit from BK Technical Analysis to help find a good entry or exit point. Technical Analysis is blind to the fundamentals and looks only at the trading data for BK stock — the real life supply and demand for the stock over time — and examines that data in different ways.
10 Most Oversold S&P 500 Stocks
10 Most Overbought S&P 500 Stocks

10 ETFs With Stocks Insiders Are Buying
10 ETFs With Most Upside To Targets
The DividendRank Top 25
Warren Buffett Dividend Stocks
10 Cheap Dividend Stocks Under $10
10 Top DividendRank'ed Energy Stocks
The 10 Highest Yielding Preferred Stocks
The 15 Most Active S&P Call & Put Options
BK DMABK MACD
Video: Technical Analysis


If the video does not load after a few moments, Upgrade to the Latest Flash Player.
Bank of York Mellon (BK) is categorized under the Financials sector; to help you further research Technical Analysis, below are some other companies in the same sector:

BLK Technical Analysis
BR Technical Analysis
BRK.B Technical Analysis
BRO Technical Analysis
BX Technical Analysis
BXP Technical Analysis
C Technical Analysis
CB Technical Analysis
CBOE Technical Analysis
CBRE Technical Analysis
More Financials companies »


BK Technical Analysis | www.TechnicalAnalysisChannel.com | Copyright © 2019 - 2025, All Rights Reserved

Nothing in TechnicalAnalysisChannel.com is intended to be investment advice, nor does it represent the opinion of, counsel from, or recommendations by BNK Invest Inc. or any of its affiliates, subsidiaries or partners. None of the information contained herein constitutes a recommendation that any particular security, portfolio, transaction, or investment strategy is suitable for any specific person. All viewers agree that under no circumstances will BNK Invest, Inc,. its subsidiaries, partners, officers, employees, affiliates, or agents be held liable for any loss or damage caused by your reliance on information obtained. By visiting, using or viewing this site, you agree to the following Full Disclaimer & Terms of Use and Privacy Policy. Video widget and market videos powered by Market News Video. Quote and option data delayed at least 15 minutes; stock quote data powered by Ticker Technologies, and Mergent.
X
Wait! Don't leave yet.
Want to receive our latest research absolutely free?


Click the button below for your complimentary copy of Your Early Retirement Portfolio: Dividends Up to 8.3%—Every Month—Forever.

You'll discover the details on 4 stocks and funds that pay you massive dividends as high as 8.3%.