
| CAT Technical Analysis Data | ||||||||||||||||
Also see: |

 52.91
52.91| CAT Current Stock Quote |
 Free CAT Email Alerts: Free CAT Email Alerts:
Get Dividend Alerts 
Get SEC Filing Alerts
|
| CAT Stock Price Chart |



| CAT Technical Analysis Data | ||||||||||||||||
Also see: |
| CAT Current Stock Quote |
| Free CAT Email Alerts:
Get Dividend Alerts
Get SEC Filing Alerts
|
| CAT Stock Price Chart |
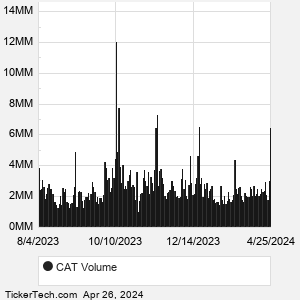
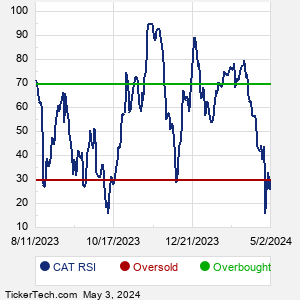
| CAT Technical Analysis Charts |
  |
| About Caterpillar Inc. |
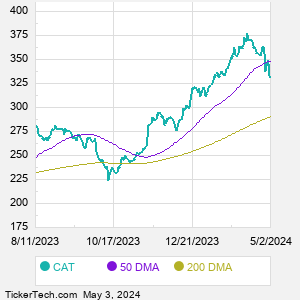
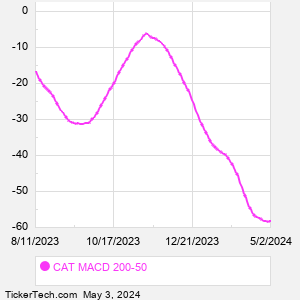
| Caterpillar is a manufacturer of construction and mining equipment, off-highway diesel and natural gas engines, industrial gas turbines and diesel-electric locomotives. Co.'s Construction Industries segment supports customers using machinery in infrastructure, forestry and building construction. Co.'s Resource Industries segment supports customers using machinery in mining and heavy construction and quarry and aggregates. Co.'s Energy and Transportation segment supports customers in oil and gas, power generation, marine, rail and industrial applications, including Co.'s machines. Co. also provides financing and related services through its Financial Products segment. When researching a stock like Caterpillar, many investors are the most familiar with Fundamental Analysis — looking at a company's balance sheet, earnings, revenues, and what's happening in that company's underlying business. Investors who use Fundamental Analysis to identify good stocks to buy or sell can also benefit from CAT Technical Analysis to help find a good entry or exit point. Technical Analysis is blind to the fundamentals and looks only at the trading data for CAT stock — the real life supply and demand for the stock over time — and examines that data in different ways. |
| CAT Technical Analysis Charts |
  |
| Video: Technical Analysis | |
|
| CAT Technical Analysis Peers |
| Caterpillar (CAT) is categorized under the Industrials sector; to help you further research Technical Analysis, below are some other companies in the same sector:
CHRW Technical Analysis |
Click the button below for your complimentary copy of Your Early Retirement Portfolio: Dividends Up to 8.7%—Every Month—Forever.
You'll discover the details on 4 stocks and funds that pay you massive dividends as high as 8.7%.


 Video: Technical Analysis