Charles River Laboratories International Technical Analysis


As of date:4/24/2024
CRL stock price:239.43
CRL 50 DMA:253.14
CRL 200 DMA:216.29
CRL MACD (200-50):-36.85
CRL RSI:38.97
Extremely
Overbought
Overbought/Oversold RSI Range
RSI Indicator (Relative Strength Index)38.97
Extremely
Oversold

Also see:
CRL Market Cap History
CRL Shares Outstanding History
CRL YTD Return

Quotes delayed 20 minutes

Email EnvelopeFree CRL Email Alerts:
Get Dividend Alerts
Get SEC Filing Alerts
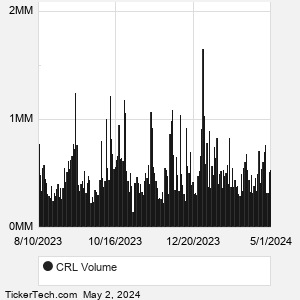
GRC Crosses Below Key Moving Average Level
12 minutes ago


Granite Ridge Resources Breaks Below 200-Day Moving Average - Notable for GRNT
14 minutes ago


RMM Makes Notable Cross Below Critical Moving Average
16 minutes ago


Pinterest (PINS) Shares Cross Below 200 DMA
17 minutes ago


Wyndham Hotels & Resorts Breaks Above 200-Day Moving Average - Bullish for WH
17 minutes ago


HOG Crosses Below Key Moving Average Level
18 minutes ago


Chemed Corp Breaks Below 200-Day Moving Average - Notable for CHE
18 minutes ago


Cleveland-Cliffs Breaks Below 200-Day Moving Average - Notable for CLF
19 minutes ago


BUYW Makes Notable Cross Below Critical Moving Average
19 minutes ago


ORCL Makes Notable Cross Below Critical Moving Average
19 minutes ago


Notable Two Hundred Day Moving Average Cross - GGG
19 minutes ago


NUE Crosses Below Key Moving Average Level
48 minutes ago


Vanguard Tax-Exempt Bond (VTEB) Shares Cross Below 200 DMA
49 minutes ago


Notable Two Hundred Day Moving Average Cross - RS
49 minutes ago


Ethan Allen Interiors Breaks Below 200-Day Moving Average - Notable for ETD
49 minutes ago


More Technical Analysis News

CRL Technical AnalysisCRL RSI
Charles River Laboratories International is a full service, non-clinical global drug development partner. Co. has laboratory animal medicine and science (research model technologies) to develop a portfolio of discovery and safety assessment services, both Good Laboratory Practice (GLP) and non-GLP, that supports its clients from target identification through non-clinical development. Co. also provides a suite of products and services to support its clients' manufacturing activities, including its contract development and manufacturing organization business. Co. has three reporting segments: Research Models and Services, Discovery and Safety Assessment and Manufacturing Solutions.

When researching a stock like Charles River Laboratories International, many investors are the most familiar with Fundamental Analysis — looking at a company's balance sheet, earnings, revenues, and what's happening in that company's underlying business. Investors who use Fundamental Analysis to identify good stocks to buy or sell can also benefit from CRL Technical Analysis to help find a good entry or exit point. Technical Analysis is blind to the fundamentals and looks only at the trading data for CRL stock — the real life supply and demand for the stock over time — and examines that data in different ways.
10 Most Oversold S&P 500 Stocks
10 Most Overbought S&P 500 Stocks

10 ETFs With Stocks Insiders Are Buying
10 ETFs With Most Upside To Targets
The DividendRank Top 25
Warren Buffett Dividend Stocks
10 Cheap Dividend Stocks Under $10
10 Top DividendRank'ed Energy Stocks
The 10 Highest Yielding Preferred Stocks
The 15 Most Active S&P Call & Put Options
CRL DMACRL MACD
Video: Technical Analysis


If the video does not load after a few moments, Upgrade to the Latest Flash Player.
Charles River Laboratories International (CRL) is categorized under the Healthcare sector; to help you further research Technical Analysis, below are some other companies in the same sector:

CTLT Technical Analysis
CVS Technical Analysis
DGX Technical Analysis
DHR Technical Analysis
DVA Technical Analysis
DXCM Technical Analysis
EW Technical Analysis
GEHC Technical Analysis
GILD Technical Analysis
HCA Technical Analysis
More Healthcare companies »


Charles River Laboratories International Technical Analysis | www.TechnicalAnalysisChannel.com | Copyright © 2019 - 2024, All Rights Reserved

Nothing in TechnicalAnalysisChannel.com is intended to be investment advice, nor does it represent the opinion of, counsel from, or recommendations by BNK Invest Inc. or any of its affiliates, subsidiaries or partners. None of the information contained herein constitutes a recommendation that any particular security, portfolio, transaction, or investment strategy is suitable for any specific person. All viewers agree that under no circumstances will BNK Invest, Inc,. its subsidiaries, partners, officers, employees, affiliates, or agents be held liable for any loss or damage caused by your reliance on information obtained. By visiting, using or viewing this site, you agree to the following Full Disclaimer & Terms of Use and Privacy Policy. Video widget and market videos powered by Market News Video. Quote and option data delayed at least 15 minutes; stock quote data powered by Ticker Technologies, and Mergent.
X
Wait! Don't leave yet.
Want to receive our latest research absolutely free?


Click the button below for your complimentary copy of Your Early Retirement Portfolio: Dividends Up to 8.7%—Every Month—Forever.

You'll discover the details on 4 stocks and funds that pay you massive dividends as high as 8.7%.