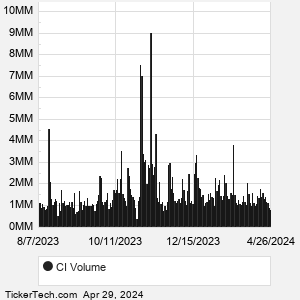
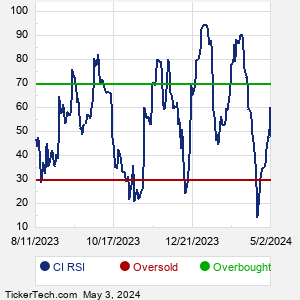
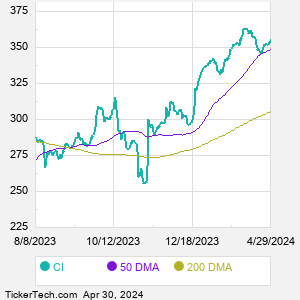
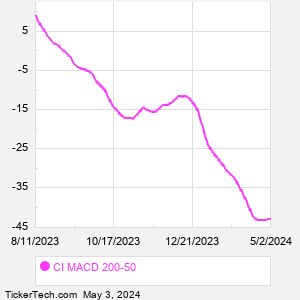
CI Technical Analysis


As of date:1/16/2025
CI stock price:280.97
CI 50 DMA:303.39
CI 200 DMA:330.74
CI MACD (200-50):27.35
CI RSI:51.56
Extremely
Overbought
Overbought/Oversold RSI Range
RSI Indicator (Relative Strength Index)51.56
Extremely
Oversold

Also see:
CI Market Cap History
CI Shares Outstanding History
CI YTD Return

Quotes delayed 20 minutes

Email EnvelopeFree CI Email Alerts:
Get Dividend Alerts
Get SEC Filing Alerts

PLPC Makes Bullish Cross Above Critical Moving Average
1 hour, 27 minutes ago


TXO Crosses Above Key Moving Average Level
1 hour, 32 minutes ago


TD Makes Bullish Cross Above Critical Moving Average
1 hour, 45 minutes ago


TD Makes Bullish Cross Above Critical Moving Average
1 hour, 46 minutes ago


Sun Communities (SUI) Shares Cross Above 200 DMA
1 hour, 58 minutes ago


Bullish Two Hundred Day Moving Average Cross - RLY
1 hour, 58 minutes ago


Snowline Gold Breaks Above 200-Day Moving Average - Bullish for SGD.CA
1 hour, 58 minutes ago


MARA Crosses Above Key Moving Average Level
5 hours, 36 minutes ago


CHX Crosses Above Key Moving Average Level
5 hours, 49 minutes ago


Okta Breaks Above 200-Day Moving Average - Bullish for OKTA
5 hours, 49 minutes ago


CLMT Makes Notable Cross Below Critical Moving Average
5 hours, 53 minutes ago


Credit Acceptance (CACC) Shares Cross Above 200 DMA
6 hours, 17 minutes ago


PCH Makes Bullish Cross Above Critical Moving Average
6 hours, 17 minutes ago


Ferrari Breaks Above 200-Day Moving Average - Bullish for RACE
6 hours, 24 minutes ago


Vontier Breaks Above 200-Day Moving Average - Bullish for VNT
6 hours, 24 minutes ago


More Technical Analysis News

CI Technical AnalysisCI RSI
The Cigna Group is a global health company. Co. has two growth platforms: Evernorth Health Services and Cigna Healthcare. Co.'s portfolio of offerings solves diverse challenges across the healthcare system. Evernorth Health Services includes a range of independent and coordinated health solutions and capabilities designed to enable the healthcare system to help people live richer, healthier lives. Health plans, employers, governmental organizations and health care providers partner with Evernorth Health Services to solve their challenges in the areas of pharmacy benefits, home delivery pharmacy, specialty pharmacy, specialty distribution, and care delivery and management solutions.

When researching a stock like Cigna, many investors are the most familiar with Fundamental Analysis — looking at a company's balance sheet, earnings, revenues, and what's happening in that company's underlying business. Investors who use Fundamental Analysis to identify good stocks to buy or sell can also benefit from CI Technical Analysis to help find a good entry or exit point. Technical Analysis is blind to the fundamentals and looks only at the trading data for CI stock — the real life supply and demand for the stock over time — and examines that data in different ways.
10 Most Oversold S&P 500 Stocks
10 Most Overbought S&P 500 Stocks

10 ETFs With Stocks Insiders Are Buying
10 ETFs With Most Upside To Targets
The DividendRank Top 25
Warren Buffett Dividend Stocks
10 Cheap Dividend Stocks Under $10
10 Top DividendRank'ed Energy Stocks
The 10 Highest Yielding Preferred Stocks
The 15 Most Active S&P Call & Put Options
CI DMACI MACD
Video: Technical Analysis


If the video does not load after a few moments, Upgrade to the Latest Flash Player.
Cigna (CI) is categorized under the Healthcare sector; to help you further research Technical Analysis, below are some other companies in the same sector:

CNC Technical Analysis
COO Technical Analysis
COR Technical Analysis
CRL Technical Analysis
CVS Technical Analysis
DGX Technical Analysis
DHR Technical Analysis
DVA Technical Analysis
DXCM Technical Analysis
EW Technical Analysis
More Healthcare companies »


CI Technical Analysis | www.TechnicalAnalysisChannel.com | Copyright © 2019 - 2025, All Rights Reserved

Nothing in TechnicalAnalysisChannel.com is intended to be investment advice, nor does it represent the opinion of, counsel from, or recommendations by BNK Invest Inc. or any of its affiliates, subsidiaries or partners. None of the information contained herein constitutes a recommendation that any particular security, portfolio, transaction, or investment strategy is suitable for any specific person. All viewers agree that under no circumstances will BNK Invest, Inc,. its subsidiaries, partners, officers, employees, affiliates, or agents be held liable for any loss or damage caused by your reliance on information obtained. By visiting, using or viewing this site, you agree to the following Full Disclaimer & Terms of Use and Privacy Policy. Video widget and market videos powered by Market News Video. Quote and option data delayed at least 15 minutes; stock quote data powered by Ticker Technologies, and Mergent.
X
Wait! Don't leave yet.
Want to receive our latest research absolutely free?


Click the button below for your complimentary copy of Your Early Retirement Portfolio: Dividends Up to 8.3%—Every Month—Forever.

You'll discover the details on 4 stocks and funds that pay you massive dividends as high as 8.3%.