Ecolab Technical Analysis


As of date:4/22/2024
ECL stock price:219.31
ECL 50 DMA:222.56
ECL 200 DMA:192.73
ECL MACD (200-50):-29.83
ECL RSI:32.27
Extremely
Overbought
Overbought/Oversold RSI Range
RSI Indicator (Relative Strength Index)32.27
Extremely
Oversold

Also see:
ECL Market Cap History
ECL Shares Outstanding History
ECL YTD Return

Quotes delayed 20 minutes

Email EnvelopeFree ECL Email Alerts:
Get Dividend Alerts
Get SEC Filing Alerts

Confluent Breaks Above 200-Day Moving Average - Bullish for CFLT
56 minutes ago


OLLI Makes Bullish Cross Above Critical Moving Average
1 hour, 16 minutes ago


Bullish Two Hundred Day Moving Average Cross - AY
1 hour, 17 minutes ago


Calamos Convertible and High Income Fund (CHY) Shares Cross Above 200 DMA
1 hour, 22 minutes ago


SYBT Crosses Above Key Moving Average Level
1 hour, 30 minutes ago


Apollo Commercial Real Estate Finance (ARI) Shares Cross Above 200 DMA
1 hour, 33 minutes ago


BlackRock Utility and Infrastructure Trust Breaks Above 200-Day Moving Average - Bullish for BUI
1 hour, 35 minutes ago


Bullish Two Hundred Day Moving Average Cross - UVV
1 hour, 38 minutes ago


ESE Makes Bullish Cross Above Critical Moving Average
1 hour, 38 minutes ago


Bullish Two Hundred Day Moving Average Cross - PHG
1 hour, 38 minutes ago


Haemonetics (HAE) Shares Cross Above 200 DMA
1 hour, 38 minutes ago


Bullish Two Hundred Day Moving Average Cross - SGY.CA
1 hour, 38 minutes ago


Cineplex Breaks Above 200-Day Moving Average - Bullish for CGX.CA
1 hour, 38 minutes ago


Bullish Two Hundred Day Moving Average Cross - PHVS
4 hours, 26 minutes ago


Bullish Two Hundred Day Moving Average Cross - BLTE
4 hours, 27 minutes ago


More Technical Analysis News

ECL Technical AnalysisECL RSI
Ecolab is a provider of water, hygiene and infection prevention solutions and services. Co.'s cleaning and sanitizing programs and products and pest elimination services support customers in the foodservice, food and beverage processing, hospitality, healthcare, government and education, retail, textile care and commercial facilities management sectors. Co.'s products and technologies are also used in water treatment, pollution control, energy conservation, refining, primary metals manufacturing, papermaking, mining and other industrial processes. Co. has three reportable segments: Global Industrial, Global Institutional and Specialty and Global Healthcare and Life Sciences.

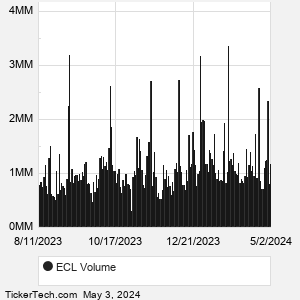
When researching a stock like Ecolab, many investors are the most familiar with Fundamental Analysis — looking at a company's balance sheet, earnings, revenues, and what's happening in that company's underlying business. Investors who use Fundamental Analysis to identify good stocks to buy or sell can also benefit from ECL Technical Analysis to help find a good entry or exit point. Technical Analysis is blind to the fundamentals and looks only at the trading data for ECL stock — the real life supply and demand for the stock over time — and examines that data in different ways.
10 Most Oversold S&P 500 Stocks
10 Most Overbought S&P 500 Stocks

10 ETFs With Stocks Insiders Are Buying
10 ETFs With Most Upside To Targets
The DividendRank Top 25
Warren Buffett Dividend Stocks
10 Cheap Dividend Stocks Under $10
10 Top DividendRank'ed Energy Stocks
The 10 Highest Yielding Preferred Stocks
The 15 Most Active S&P Call & Put Options
ECL DMAECL MACD
Video: Technical Analysis


If the video does not load after a few moments, Upgrade to the Latest Flash Player.
Ecolab (ECL) is categorized under the Materials sector; to help you further research Technical Analysis, below are some other companies in the same sector:

EMN Technical Analysis
FCX Technical Analysis
FMC Technical Analysis
HWM Technical Analysis
IFF Technical Analysis
IP Technical Analysis
LIN Technical Analysis
LYB Technical Analysis
MAS Technical Analysis
MHK Technical Analysis
More Materials companies »


Ecolab Technical Analysis | www.TechnicalAnalysisChannel.com | Copyright © 2019 - 2024, All Rights Reserved

Nothing in TechnicalAnalysisChannel.com is intended to be investment advice, nor does it represent the opinion of, counsel from, or recommendations by BNK Invest Inc. or any of its affiliates, subsidiaries or partners. None of the information contained herein constitutes a recommendation that any particular security, portfolio, transaction, or investment strategy is suitable for any specific person. All viewers agree that under no circumstances will BNK Invest, Inc,. its subsidiaries, partners, officers, employees, affiliates, or agents be held liable for any loss or damage caused by your reliance on information obtained. By visiting, using or viewing this site, you agree to the following Full Disclaimer & Terms of Use and Privacy Policy. Video widget and market videos powered by Market News Video. Quote and option data delayed at least 15 minutes; stock quote data powered by Ticker Technologies, and Mergent.
X
Wait! Don't leave yet.
Want to receive our latest research absolutely free?


Click the button below for your complimentary copy of Your Early Retirement Portfolio: Dividends Up to 8.7%—Every Month—Forever.

You'll discover the details on 4 stocks and funds that pay you massive dividends as high as 8.7%.