ETR Technical Analysis


As of date:3/15/2024
ETR stock price:101.96
ETR 50 DMA:100.38
ETR 200 DMA:96.79
ETR MACD (200-50):-3.59
ETR RSI:62.80
Extremely
Overbought
Overbought/Oversold RSI Range
RSI Indicator (Relative Strength Index)62.80
Extremely
Oversold

Also see:
ETR Market Cap History
ETR Shares Outstanding History
ETR YTD Return

Quotes delayed 20 minutes

Email EnvelopeFree ETR Email Alerts:
Get Dividend Alerts
Get SEC Filing Alerts

FWONK Crosses Below Key Moving Average Level
1 hour, 19 minutes ago


Lands' End Breaks Below 200-Day Moving Average - Notable for LE
1 hour, 25 minutes ago


Notable Two Hundred Day Moving Average Cross - CATY
1 hour, 28 minutes ago


MEOH Makes Bullish Cross Above Critical Moving Average
1 hour, 28 minutes ago


HELE Makes Notable Cross Below Critical Moving Average
1 hour, 29 minutes ago


iShares 3-7 Year Treasury Bond (IEI) Shares Cross Below 200 DMA
1 hour, 42 minutes ago


First Trust TCW Opportunistic Fixed Income Breaks Below 200-Day Moving Average - Notable for FIXD
1 hour, 42 minutes ago


BSMO Makes Notable Cross Below Critical Moving Average
1 hour, 48 minutes ago


TMV Makes Bullish Cross Above Critical Moving Average
1 hour, 49 minutes ago


Invesco DB Oil Fund Breaks Above 200-Day Moving Average - Bullish for DBO
1 hour, 49 minutes ago


iShares J.P. Morgan EM Local Currency Bond Breaks Below 200-Day Moving Average - Notable for LEMB
1 hour, 49 minutes ago


BLV Crosses Below Key Moving Average Level
1 hour, 49 minutes ago


LI Makes Notable Cross Below Critical Moving Average
6 hours, 10 minutes ago


Bullish Two Hundred Day Moving Average Cross - NVEI
6 hours, 10 minutes ago


Terns Pharmaceuticals (TERN) Shares Cross Below 200 DMA
6 hours, 12 minutes ago


More Technical Analysis News

ETR Technical AnalysisETR RSI
Entergy is a holding company. Through its subsidiaries, Co. is an integrated energy company engaged primarily in electric power production and retail distribution operations. Co.'s business segments include: Utility, which includes the generation, transmission, distribution, and sale of electric power in portions of Arkansas, Mississippi, Texas, and Louisiana, including the City of New Orleans, and operation of a small natural gas distribution business; and Entergy Wholesale Commodities, which includes the ownership, operation, and decommissioning of nuclear power plants located in the northern U.S. and the sale of the electric power produced by its operating plants to wholesale customers.

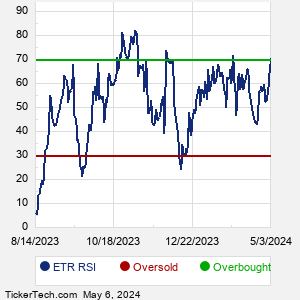
When researching a stock like Entergy, many investors are the most familiar with Fundamental Analysis — looking at a company's balance sheet, earnings, revenues, and what's happening in that company's underlying business. Investors who use Fundamental Analysis to identify good stocks to buy or sell can also benefit from ETR Technical Analysis to help find a good entry or exit point. Technical Analysis is blind to the fundamentals and looks only at the trading data for ETR stock — the real life supply and demand for the stock over time — and examines that data in different ways.
10 Most Oversold S&P 500 Stocks
10 Most Overbought S&P 500 Stocks

10 ETFs With Stocks Insiders Are Buying
10 ETFs With Most Upside To Targets
The DividendRank Top 25
Warren Buffett Dividend Stocks
10 Cheap Dividend Stocks Under $10
10 Top DividendRank'ed Energy Stocks
The 10 Highest Yielding Preferred Stocks
The 15 Most Active S&P Call & Put Options
ETR DMAETR MACD
Video: Technical Analysis


If the video does not load after a few moments, Upgrade to the Latest Flash Player.
Entergy (ETR) is categorized under the Utilities sector; to help you further research Technical Analysis, below are some other companies in the same sector:

EVRG Technical Analysis
EXC Technical Analysis
FE Technical Analysis
LNT Technical Analysis
NEE Technical Analysis
NI Technical Analysis
NRG Technical Analysis
PCG Technical Analysis
PEG Technical Analysis
PNW Technical Analysis
More Utilities companies »


ETR Technical Analysis | www.TechnicalAnalysisChannel.com | Copyright © 2019 - 2024, All Rights Reserved

Nothing in TechnicalAnalysisChannel.com is intended to be investment advice, nor does it represent the opinion of, counsel from, or recommendations by BNK Invest Inc. or any of its affiliates, subsidiaries or partners. None of the information contained herein constitutes a recommendation that any particular security, portfolio, transaction, or investment strategy is suitable for any specific person. All viewers agree that under no circumstances will BNK Invest, Inc,. its subsidiaries, partners, officers, employees, affiliates, or agents be held liable for any loss or damage caused by your reliance on information obtained. By visiting, using or viewing this site, you agree to the following Full Disclaimer & Terms of Use and Privacy Policy. Video widget and market videos powered by Market News Video. Quote and option data delayed at least 15 minutes; stock quote data powered by Ticker Technologies, and Mergent.
X
Wait! Don't leave yet.
Want to receive our latest research absolutely free?


Click the button below for your complimentary copy of Your Early Retirement Portfolio: Dividends Up to 9.5%—Every Month—Forever.

You'll discover the details on 4 stocks and funds that pay you massive dividends as high as 9.5%.