FLT Technical Analysis
As of date:10/3/2023
FLT stock price:249.77
FLT 50 DMA:262.86
FLT 200 DMA:228.43
FLT MACD (200-50):-34.43
FLT RSI:17.99
Extremely
Overbought
Overbought/Oversold RSI Range
RSI Indicator (Relative Strength Index)17.99
Extremely
Oversold

Also see:
FLT Market Cap History
FLT Shares Outstanding History
FLT YTD Return

Quotes delayed 20 minutes

Email EnvelopeFree FLT Email Alerts:
Get Dividend Alerts
Get SEC Filing Alerts

LNTH Makes Bullish Cross Above Critical Moving Average
1 hour, 4 minutes ago


Tile Shop Holdings (TTSH) Shares Cross Below 200 DMA
1 hour, 6 minutes ago


Advanced Energy Industries (AEIS) Shares Cross Below 200 DMA
1 hour, 14 minutes ago


IPAR Crosses Below Key Moving Average Level
1 hour, 19 minutes ago


Notable Two Hundred Day Moving Average Cross - ORLY
1 hour, 22 minutes ago


Invesco Leisure and Entertainment Getting Very Oversold
1 hour, 24 minutes ago


Notable Two Hundred Day Moving Average Cross - PX
1 hour, 25 minutes ago


Shares of IXG Now Oversold
1 hour, 25 minutes ago


PHB Crowded With Sellers
1 hour, 25 minutes ago


iShares MSCI Mexico (EWW) Enters Oversold Territory
1 hour, 26 minutes ago


ITOT Makes Notable Cross Below Critical Moving Average
1 hour, 26 minutes ago


HYBB Crosses Critical Technical Indicator
1 hour, 26 minutes ago


HYS Getting Very Oversold
1 hour, 27 minutes ago


HYDW Enters Oversold Territory
1 hour, 27 minutes ago


RBC Bearings Breaks Below 200-Day Moving Average - Notable for RBCP
1 hour, 27 minutes ago


More Technical Analysis News

FLT Technical AnalysisFLT RSI
FleetCor Technologies is a provider of digital payment solutions. Co. has three reportable segments, North America, International, and Brazil. Co.'s proprietary processing and card management solutions provide customers with capabilities including: customizable user-level controls, detailed transaction reporting, programmable alerts, configurable networks, contract price validation and audit, and tax management and reporting. Co.'s Corporate Payments solutions are designed to help businesses streamline the back-office operations associated with making outgoing payments. Co. provides integrated gift card program management and processing services, in both plastic and digital form.

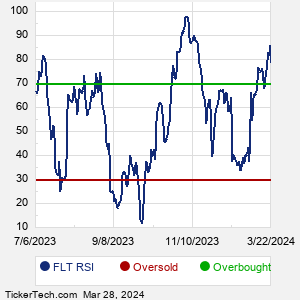
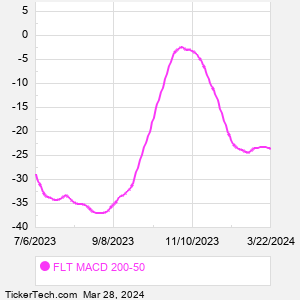
When researching a stock like FleetCor Technologies, many investors are the most familiar with Fundamental Analysis — looking at a company's balance sheet, earnings, revenues, and what's happening in that company's underlying business. Investors who use Fundamental Analysis to identify good stocks to buy or sell can also benefit from FLT Technical Analysis to help find a good entry or exit point. Technical Analysis is blind to the fundamentals and looks only at the trading data for FLT stock — the real life supply and demand for the stock over time — and examines that data in different ways.
10 Most Oversold S&P 500 Stocks
10 Most Overbought S&P 500 Stocks

10 ETFs With Stocks Insiders Are Buying
10 ETFs With Most Upside To Targets
The DividendRank Top 25
Warren Buffett Dividend Stocks
10 Cheap Dividend Stocks Under $10
10 Top DividendRank'ed Energy Stocks
The 10 Highest Yielding Preferred Stocks
The 15 Most Active S&P Call & Put Options
FLT DMAFLT MACD
Video: Technical Analysis


If the video does not load after a few moments, Upgrade to the Latest Flash Player.
FleetCor Technologies (FLT) is categorized under the Industrials sector; to help you further research Technical Analysis, below are some other companies in the same sector:

FTV Technical Analysis
GD Technical Analysis
GE Technical Analysis
GLW Technical Analysis
GNRC Technical Analysis
GPN Technical Analysis
GWW Technical Analysis
HII Technical Analysis
IEX Technical Analysis
INTU Technical Analysis
More Industrials companies »


FLT Technical Analysis | www.TechnicalAnalysisChannel.com | Copyright © 2019 - 2023, All Rights Reserved

Nothing in TechnicalAnalysisChannel.com is intended to be investment advice, nor does it represent the opinion of, counsel from, or recommendations by BNK Invest Inc. or any of its affiliates, subsidiaries or partners. None of the information contained herein constitutes a recommendation that any particular security, portfolio, transaction, or investment strategy is suitable for any specific person. All viewers agree that under no circumstances will BNK Invest, Inc,. its subsidiaries, partners, officers, employees, affiliates, or agents be held liable for any loss or damage caused by your reliance on information obtained. By visiting, using or viewing this site, you agree to the following Full Disclaimer & Terms of Use and Privacy Policy. Video widget and market videos powered by Market News Video. Quote and option data delayed at least 15 minutes; stock quote data powered by Ticker Technologies, and Mergent.
X
Wait! Don't leave yet.
Want to receive our latest research absolutely free?


Click the button below for your complimentary copy of Your Early Retirement Portfolio: Dividends Up to 7.8%—Every Month—Forever.

You'll discover the details on 4 stocks and funds that pay you massive dividends as high as 7.8%.