GWW Technical Analysis


As of date:5/15/2025
GWW stock price:1084.51
GWW 50 DMA:999.02
GWW 200 DMA:1044.37
GWW MACD (200-50):45.35
GWW RSI:74.32
Extremely
Overbought
Overbought/Oversold RSI Range
RSI Indicator (Relative Strength Index)74.32
Extremely
Oversold

Also see:
GWW Market Cap History
GWW Shares Outstanding History
GWW YTD Return

Quotes delayed 20 minutes

Email EnvelopeFree GWW Email Alerts:
Get Dividend Alerts
Get SEC Filing Alerts

CHMG Crosses Above Key Moving Average Level
17 hours, 5 minutes ago


Bullish Two Hundred Day Moving Average Cross - EXAS
17 hours, 5 minutes ago


National Beverage (FIZZ) Shares Cross Above 200 DMA
17 hours, 10 minutes ago


TQQQ Makes Bullish Cross Above Critical Moving Average
17 hours, 14 minutes ago


MSCI Crosses Above Key Moving Average Level
17 hours, 14 minutes ago


Bullish Two Hundred Day Moving Average Cross - OTIS
17 hours, 19 minutes ago


SPIR Crosses Above Key Moving Average Level
17 hours, 20 minutes ago


Bullish Two Hundred Day Moving Average Cross - OTIS
17 hours, 20 minutes ago


Bullish Two Hundred Day Moving Average Cross - DBRG
17 hours, 20 minutes ago


Bullish Two Hundred Day Moving Average Cross - GPC
17 hours, 21 minutes ago


Fairlead Tactical Sector Breaks Above 200-Day Moving Average - Bullish for TACK
17 hours, 21 minutes ago


Bullish Two Hundred Day Moving Average Cross - USSE
17 hours, 21 minutes ago


Bullish Two Hundred Day Moving Average Cross - OUSA
17 hours, 25 minutes ago


NextEra Energy (NEE) Shares Cross Above 200 DMA
17 hours, 25 minutes ago


TEAM Crosses Below Key Moving Average Level
21 hours, 49 minutes ago


More Technical Analysis News

GWW Technical AnalysisGWW RSI
W.W. Grainger, Inc. is a broad line, distributor of maintenance, repair and operating (MRO) products and services with operations primarily in North America, Japan and the United Kingdom. Co. operates through two segments: High-Touch Solutions North America (High-Touch Solutions N.A.) and Endless Assortment. High-Touch Solutions N.A. segment provides value-added MRO solutions. This segment primarily includes the Grainger-branded businesses in the U.S. (U.S.), Canada, Mexico and Puerto Rico. The Endless Assortment segment provides a streamlined and transparent online platform.

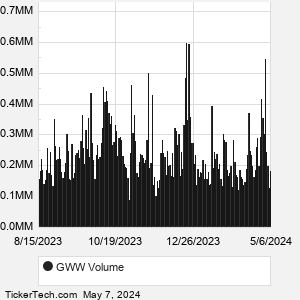
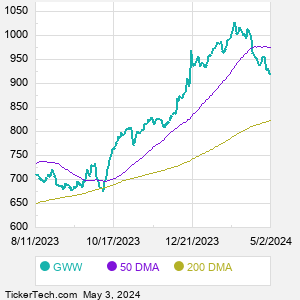
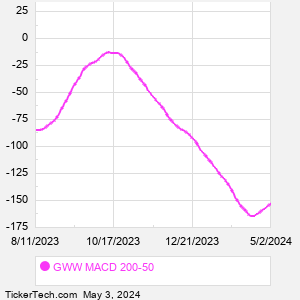
When researching a stock like W.W. Grainger, many investors are the most familiar with Fundamental Analysis — looking at a company's balance sheet, earnings, revenues, and what's happening in that company's underlying business. Investors who use Fundamental Analysis to identify good stocks to buy or sell can also benefit from GWW Technical Analysis to help find a good entry or exit point. Technical Analysis is blind to the fundamentals and looks only at the trading data for GWW stock — the real life supply and demand for the stock over time — and examines that data in different ways.
10 Most Oversold S&P 500 Stocks
10 Most Overbought S&P 500 Stocks

10 ETFs With Stocks Insiders Are Buying
10 ETFs With Most Upside To Targets
The DividendRank Top 25
Warren Buffett Dividend Stocks
10 Cheap Dividend Stocks Under $10
10 Top DividendRank'ed Energy Stocks
The 10 Highest Yielding Preferred Stocks
The 15 Most Active S&P Call & Put Options
GWW DMAGWW MACD
Video: Technical Analysis


If the video does not load after a few moments, Upgrade to the Latest Flash Player.
W.W. Grainger (GWW) is categorized under the Industrials sector; to help you further research Technical Analysis, below are some other companies in the same sector:

HII Technical Analysis
HUBB Technical Analysis
IEX Technical Analysis
INTU Technical Analysis
IR Technical Analysis
IT Technical Analysis
ITW Technical Analysis
J Technical Analysis
JBHT Technical Analysis
JBL Technical Analysis
More Industrials companies »


GWW Technical Analysis | www.TechnicalAnalysisChannel.com | Copyright © 2019 - 2025, All Rights Reserved

Nothing in TechnicalAnalysisChannel.com is intended to be investment advice, nor does it represent the opinion of, counsel from, or recommendations by BNK Invest Inc. or any of its affiliates, subsidiaries or partners. None of the information contained herein constitutes a recommendation that any particular security, portfolio, transaction, or investment strategy is suitable for any specific person. All viewers agree that under no circumstances will BNK Invest, Inc,. its subsidiaries, partners, officers, employees, affiliates, or agents be held liable for any loss or damage caused by your reliance on information obtained. By visiting, using or viewing this site, you agree to the following Full Disclaimer & Terms of Use and Privacy Policy. Video widget and market videos powered by Market News Video. Quote and option data delayed at least 15 minutes; stock quote data powered by Ticker Technologies, and Mergent.
X
Wait! Don't leave yet.
Want to receive our latest research absolutely free?


Click the button below for your complimentary copy of Your Early Retirement Portfolio: Dividends Up to 8.7%—Every Month—Forever.

You'll discover the details on 4 stocks and funds that pay you massive dividends as high as 8.7%.