ICE Technical Analysis


As of date:2/6/2025
ICE stock price:167.68
ICE 50 DMA:154.04
ICE 200 DMA:150.03
ICE MACD (200-50):-4.01
ICE RSI:79.61
Extremely
Overbought
Overbought/Oversold RSI Range
RSI Indicator (Relative Strength Index)79.61
Extremely
Oversold

Also see:
ICE Market Cap History
ICE Shares Outstanding History
ICE YTD Return

Quotes delayed 20 minutes

Email EnvelopeFree ICE Email Alerts:
Get Dividend Alerts
Get SEC Filing Alerts

Virtus Newfleet Multi-Sector Bond Breaks Below 200-Day Moving Average - Notable for NFLT
45 minutes ago


Notable Two Hundred Day Moving Average Cross - SPRY
55 minutes ago


VITL Makes Notable Cross Below Critical Moving Average
56 minutes ago


AvidXchange Holdings Breaks Below 200-Day Moving Average - Notable for AVDX
56 minutes ago


ProPetro Holding Breaks Below 200-Day Moving Average - Notable for PUMP
1 hour, 4 minutes ago


PFG Crosses Above Key Moving Average Level
1 hour, 6 minutes ago


Rivernorth Opportunities Fund Breaks Above 200-Day Moving Average - Bullish for RIV
1 hour, 6 minutes ago


MRC Global Breaks Below 200-Day Moving Average - Notable for MRC
1 hour, 6 minutes ago


ENS Makes Bullish Cross Above Critical Moving Average
1 hour, 6 minutes ago


Notable Two Hundred Day Moving Average Cross - BUI
1 hour, 6 minutes ago


Ingevity (NGVT) Shares Cross Below 200 DMA
1 hour, 6 minutes ago


WST Crosses Below Key Moving Average Level
1 hour, 7 minutes ago


JSCP Makes Notable Cross Below Critical Moving Average
1 hour, 7 minutes ago


Skechers USA Breaks Below 200-Day Moving Average - Notable for SKX
1 hour, 7 minutes ago


PCVX Makes Notable Cross Below Critical Moving Average
1 hour, 10 minutes ago


More Technical Analysis News

ICE Technical AnalysisICE RSI
Intercontinental Exchange, Inc. is a global provider of technology and data to a range of customers including financial institutions, corporations, and government entities. Co. operates through three segments: Exchanges, Fixed Income and Data Services, and Mortgage Technology. The Exchanges segment operates regulated marketplace technology for the listing, trading, and clearing of an array of derivatives contracts and financial securities. The Fixed Income and Data Services segment provides fixed income pricing, reference data, indices, analytics, and execution services, as well as global credit default swaps (CDS), clearing and multi-asset class data delivery technology.

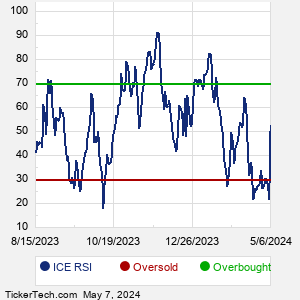
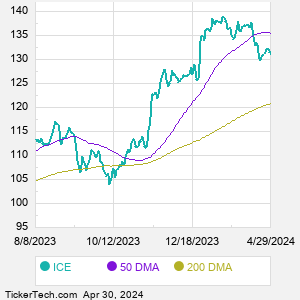
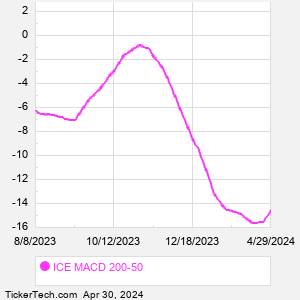
When researching a stock like Intercontinental Exchange, many investors are the most familiar with Fundamental Analysis — looking at a company's balance sheet, earnings, revenues, and what's happening in that company's underlying business. Investors who use Fundamental Analysis to identify good stocks to buy or sell can also benefit from ICE Technical Analysis to help find a good entry or exit point. Technical Analysis is blind to the fundamentals and looks only at the trading data for ICE stock — the real life supply and demand for the stock over time — and examines that data in different ways.
10 Most Oversold S&P 500 Stocks
10 Most Overbought S&P 500 Stocks

10 ETFs With Stocks Insiders Are Buying
10 ETFs With Most Upside To Targets
The DividendRank Top 25
Warren Buffett Dividend Stocks
10 Cheap Dividend Stocks Under $10
10 Top DividendRank'ed Energy Stocks
The 10 Highest Yielding Preferred Stocks
The 15 Most Active S&P Call & Put Options
ICE DMAICE MACD
Video: Technical Analysis


If the video does not load after a few moments, Upgrade to the Latest Flash Player.
Intercontinental Exchange (ICE) is categorized under the Financials sector; to help you further research Technical Analysis, below are some other companies in the same sector:

INVH Technical Analysis
IVZ Technical Analysis
JPM Technical Analysis
KEY Technical Analysis
KIM Technical Analysis
KKR Technical Analysis
L Technical Analysis
MAA Technical Analysis
MET Technical Analysis
MKTX Technical Analysis
More Financials companies »


ICE Technical Analysis | www.TechnicalAnalysisChannel.com | Copyright © 2019 - 2025, All Rights Reserved

Nothing in TechnicalAnalysisChannel.com is intended to be investment advice, nor does it represent the opinion of, counsel from, or recommendations by BNK Invest Inc. or any of its affiliates, subsidiaries or partners. None of the information contained herein constitutes a recommendation that any particular security, portfolio, transaction, or investment strategy is suitable for any specific person. All viewers agree that under no circumstances will BNK Invest, Inc,. its subsidiaries, partners, officers, employees, affiliates, or agents be held liable for any loss or damage caused by your reliance on information obtained. By visiting, using or viewing this site, you agree to the following Full Disclaimer & Terms of Use and Privacy Policy. Video widget and market videos powered by Market News Video. Quote and option data delayed at least 15 minutes; stock quote data powered by Ticker Technologies, and Mergent.
X
Wait! Don't leave yet.
Want to receive our latest research absolutely free?


Click the button below for your complimentary copy of Your Early Retirement Portfolio: Dividends Up to 8.3%—Every Month—Forever.

You'll discover the details on 4 stocks and funds that pay you massive dividends as high as 8.3%.