MAR Technical Analysis


As of date:1/23/2025
MAR stock price:285.07
MAR 50 DMA:282.41
MAR 200 DMA:250.13
MAR MACD (200-50):-32.28
MAR RSI:59.43
Extremely
Overbought
Overbought/Oversold RSI Range
RSI Indicator (Relative Strength Index)59.43
Extremely
Oversold

Also see:
MAR Market Cap History
MAR Shares Outstanding History
MAR YTD Return

Quotes delayed 20 minutes

Email EnvelopeFree MAR Email Alerts:
Get Dividend Alerts
Get SEC Filing Alerts

Bullish Two Hundred Day Moving Average Cross - GBDC
1 hour, 13 minutes ago


Bullish Two Hundred Day Moving Average Cross - LOCO
1 hour, 14 minutes ago


MSBI Crosses Below Key Moving Average Level
1 hour, 15 minutes ago


PARA Crosses Above Key Moving Average Level
1 hour, 21 minutes ago


DJCO Crosses Below Key Moving Average Level
1 hour, 33 minutes ago


Riskified Ltd Breaks Above 200-Day Moving Average - Bullish for RSKD
1 hour, 38 minutes ago


IBTH Makes Bullish Cross Above Critical Moving Average
1 hour, 38 minutes ago


Vanguard International High Dividend Yield Breaks Above 200-Day Moving Average - Bullish for VYMI
1 hour, 38 minutes ago


Bullish Two Hundred Day Moving Average Cross - EEMA
1 hour, 38 minutes ago


Notable Two Hundred Day Moving Average Cross - GRNT
1 hour, 38 minutes ago


MFDX Crosses Above Key Moving Average Level
1 hour, 57 minutes ago


Bullish Two Hundred Day Moving Average Cross - INTF
1 hour, 57 minutes ago


Bullish Two Hundred Day Moving Average Cross - EMQQ
1 hour, 57 minutes ago


Bullish Two Hundred Day Moving Average Cross - CWEB
1 hour, 57 minutes ago


iShares iBonds Dec 2028 Term Corporate (IBDT) Shares Cross Above 200 DMA
1 hour, 57 minutes ago


More Technical Analysis News

MAR Technical AnalysisMAR RSI
Marriott International, Inc. is an operator, franchisor, and licensor of hotel, residential, timeshare, and other lodging properties under various brand names. Co.'s segments include U.S. & Canada, Europe, Middle East, and Africa, Asia Pacific excluding China, and Greater China. Its Classic Luxury hotel brands include JW Marriott, The Ritz-Carlton, and St. Regis. Its Distinctive Luxury hotel brands include The Luxury Collection, W Hotels, EDITION, and Bvlgari. Its Classic Premium brands include Marriott Hotels, Sheraton, Delta Hotels by Marriott, Marriott Executive Apartments, and Marriott Vacation Club.

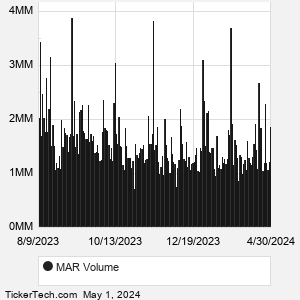
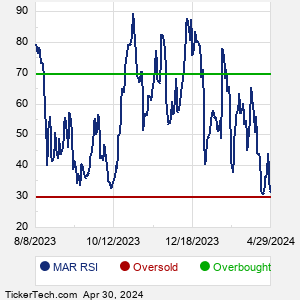
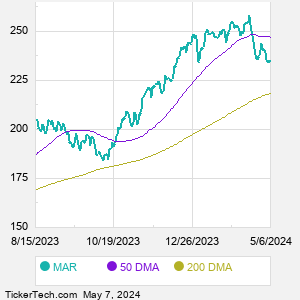
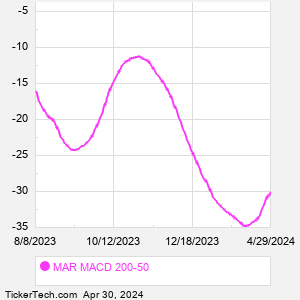
When researching a stock like Marriott International, many investors are the most familiar with Fundamental Analysis — looking at a company's balance sheet, earnings, revenues, and what's happening in that company's underlying business. Investors who use Fundamental Analysis to identify good stocks to buy or sell can also benefit from MAR Technical Analysis to help find a good entry or exit point. Technical Analysis is blind to the fundamentals and looks only at the trading data for MAR stock — the real life supply and demand for the stock over time — and examines that data in different ways.
10 Most Oversold S&P 500 Stocks
10 Most Overbought S&P 500 Stocks

10 ETFs With Stocks Insiders Are Buying
10 ETFs With Most Upside To Targets
The DividendRank Top 25
Warren Buffett Dividend Stocks
10 Cheap Dividend Stocks Under $10
10 Top DividendRank'ed Energy Stocks
The 10 Highest Yielding Preferred Stocks
The 15 Most Active S&P Call & Put Options
MAR DMAMAR MACD
Video: Technical Analysis


If the video does not load after a few moments, Upgrade to the Latest Flash Player.
Marriott International (MAR) is categorized under the Services sector; to help you further research Technical Analysis, below are some other companies in the same sector:

MCD Technical Analysis
META Technical Analysis
MGM Technical Analysis
MTCH Technical Analysis
NFLX Technical Analysis
NVR Technical Analysis
NWS Technical Analysis
NWSA Technical Analysis
OMC Technical Analysis
ORLY Technical Analysis
More Services companies »


MAR Technical Analysis | www.TechnicalAnalysisChannel.com | Copyright © 2019 - 2025, All Rights Reserved

Nothing in TechnicalAnalysisChannel.com is intended to be investment advice, nor does it represent the opinion of, counsel from, or recommendations by BNK Invest Inc. or any of its affiliates, subsidiaries or partners. None of the information contained herein constitutes a recommendation that any particular security, portfolio, transaction, or investment strategy is suitable for any specific person. All viewers agree that under no circumstances will BNK Invest, Inc,. its subsidiaries, partners, officers, employees, affiliates, or agents be held liable for any loss or damage caused by your reliance on information obtained. By visiting, using or viewing this site, you agree to the following Full Disclaimer & Terms of Use and Privacy Policy. Video widget and market videos powered by Market News Video. Quote and option data delayed at least 15 minutes; stock quote data powered by Ticker Technologies, and Mergent.
X
Wait! Don't leave yet.
Want to receive our latest research absolutely free?


Click the button below for your complimentary copy of Your Early Retirement Portfolio: Dividends Up to 8.3%—Every Month—Forever.

You'll discover the details on 4 stocks and funds that pay you massive dividends as high as 8.3%.