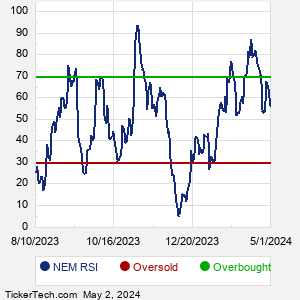
NEM Technical Analysis


As of date:4/17/2025
NEM stock price:55.08
NEM 50 DMA:46.79
NEM 200 DMA:46.32
NEM MACD (200-50):-0.47
NEM RSI:68.80
Extremely
Overbought
Overbought/Oversold RSI Range
RSI Indicator (Relative Strength Index)68.80
Extremely
Oversold

Also see:
NEM Market Cap History
NEM Shares Outstanding History
NEM YTD Return

Quotes delayed 20 minutes

Email EnvelopeFree NEM Email Alerts:
Get Dividend Alerts
Get SEC Filing Alerts
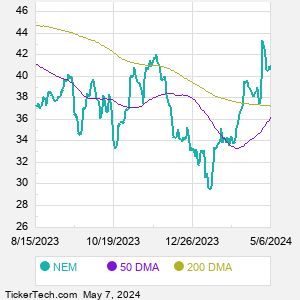
PID Crosses Above Key Moving Average Level
Thursday, April 17, 4:12 PM


CCI Crosses Above Key Moving Average Level
Thursday, April 17, 4:10 PM


Notable Two Hundred Day Moving Average Cross - SNA
Thursday, April 17, 4:10 PM


X-trackers International Real Estate (HAUZ) Shares Cross Above 200 DMA
Thursday, April 17, 3:52 PM


IIIN Crosses Above Key Moving Average Level
Thursday, April 17, 3:52 PM


Bullish Two Hundred Day Moving Average Cross - YEAR
Wednesday, April 16, 5:12 PM


Bullish Two Hundred Day Moving Average Cross - IEF
Wednesday, April 16, 5:09 PM


iShares iBonds Dec 2033 Term Treasury Breaks Above 200-Day Moving Average - Bullish for IBTO
Wednesday, April 16, 5:09 PM


Notable Two Hundred Day Moving Average Cross - AUR
Wednesday, April 16, 5:08 PM


CURV Makes Bullish Cross Above Critical Moving Average
Wednesday, April 16, 11:52 AM


Shares of KMLM Now Oversold
Wednesday, April 16, 11:52 AM


TKNO Crosses Above Key Moving Average Level
Wednesday, April 16, 11:44 AM


RCAT Crosses Below Key Moving Average Level
Wednesday, April 16, 11:42 AM


iShares iBonds Dec 2031 Term Treasury (IBTL) Shares Cross Above 200 DMA
Tuesday, April 15, 4:08 PM


iShares iBonds Dec 2032 Term Treasury Breaks Above 200-Day Moving Average - Bullish for IBTM
Tuesday, April 15, 4:08 PM


More Technical Analysis News

NEM Technical AnalysisNEM RSI
Newmont Corporation is a gold company and a producer of copper, zinc, lead, and silver. Co.'s portfolio of assets and prospects is anchored in mining jurisdictions in Africa, Australia, Latin America & Caribbean, North America, and Papua New Guinea. Its African operations include Ahafo and Akyem. Its Australian operations include Boddington, Cadia, Tanami and Telfer. Its Latin America and Caribbean (LATAC) operations include Cerro Negro, Merian, Penasquito, Pueblo Viejo JV and Yanacocha. Its North American projects include Brucejack, Cripple Creek & Victor, Eleonore, Musselwhite, Nevada Gold Mines JV, Porcupine and Red Chris. Its Papua New Guinea projects include Lihir.

When researching a stock like Newmont Goldcorp, many investors are the most familiar with Fundamental Analysis — looking at a company's balance sheet, earnings, revenues, and what's happening in that company's underlying business. Investors who use Fundamental Analysis to identify good stocks to buy or sell can also benefit from NEM Technical Analysis to help find a good entry or exit point. Technical Analysis is blind to the fundamentals and looks only at the trading data for NEM stock — the real life supply and demand for the stock over time — and examines that data in different ways.
10 Most Oversold S&P 500 Stocks
10 Most Overbought S&P 500 Stocks

10 ETFs With Stocks Insiders Are Buying
10 ETFs With Most Upside To Targets
The DividendRank Top 25
Warren Buffett Dividend Stocks
10 Cheap Dividend Stocks Under $10
10 Top DividendRank'ed Energy Stocks
The 10 Highest Yielding Preferred Stocks
The 15 Most Active S&P Call & Put Options
NEM DMANEM MACD
Video: Technical Analysis


If the video does not load after a few moments, Upgrade to the Latest Flash Player.
Newmont Goldcorp (NEM) is categorized under the Materials sector; to help you further research Technical Analysis, below are some other companies in the same sector:

NUE Technical Analysis
PKG Technical Analysis
PPG Technical Analysis
SHW Technical Analysis
STLD Technical Analysis
VMC Technical Analysis
ALB Technical Analysis
APD Technical Analysis
AVY Technical Analysis
BALL Technical Analysis
More Materials companies »


NEM Technical Analysis | www.TechnicalAnalysisChannel.com | Copyright © 2019 - 2025, All Rights Reserved

Nothing in TechnicalAnalysisChannel.com is intended to be investment advice, nor does it represent the opinion of, counsel from, or recommendations by BNK Invest Inc. or any of its affiliates, subsidiaries or partners. None of the information contained herein constitutes a recommendation that any particular security, portfolio, transaction, or investment strategy is suitable for any specific person. All viewers agree that under no circumstances will BNK Invest, Inc,. its subsidiaries, partners, officers, employees, affiliates, or agents be held liable for any loss or damage caused by your reliance on information obtained. By visiting, using or viewing this site, you agree to the following Full Disclaimer & Terms of Use and Privacy Policy. Video widget and market videos powered by Market News Video. Quote and option data delayed at least 15 minutes; stock quote data powered by Ticker Technologies, and Mergent.
X
Wait! Don't leave yet.
Want to receive our latest research absolutely free?


Click the button below for your complimentary copy of Your Early Retirement Portfolio: Dividends Up to 8.7%—Every Month—Forever.

You'll discover the details on 4 stocks and funds that pay you massive dividends as high as 8.7%.