NWSA Technical Analysis


As of date:4/18/2024
NWSA stock price:24.03
NWSA 50 DMA:25.74
NWSA 200 DMA:22.51
NWSA MACD (200-50):-3.23
NWSA RSI:17.33
Extremely
Overbought
Overbought/Oversold RSI Range
RSI Indicator (Relative Strength Index)17.33
Extremely
Oversold

Also see:
NWSA Market Cap History
NWSA Shares Outstanding History
NWSA YTD Return

Quotes delayed 20 minutes

Email EnvelopeFree NWSA Email Alerts:
Get Dividend Alerts
Get SEC Filing Alerts
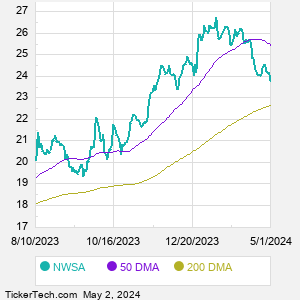
CHMG Makes Bullish Cross Above Critical Moving Average
1 minute ago


ONEQ Enters Oversold Territory
2 minutes ago


PDP Crowded With Sellers
2 minutes ago


FV Crosses Critical Technical Indicator
2 minutes ago


LRGE Crowded With Sellers
2 minutes ago


JTEK Getting Very Oversold
2 minutes ago


Shares of QQEW Now Oversold
2 minutes ago


Columbia Sportswear (COLM) Shares Cross Above 200 DMA
2 minutes ago


FTXL Crosses Critical Technical Indicator
2 minutes ago


PABU Enters Oversold Territory
3 minutes ago


First Trust Nasdaq BuyWrite Income (FTQI) Enters Oversold Territory
3 minutes ago


Shares of JEPQ Now Oversold
3 minutes ago


QYLD Crowded With Sellers
4 minutes ago


Shares of ARKQ Now Oversold
4 minutes ago


Invesco PHLX Semiconductor Getting Very Oversold
4 minutes ago


More Technical Analysis News

NWSA Technical AnalysisNWSA RSI
News is a media and information services company focused on creating and distributing content and other products and services to consumers and businesses. Co. comprises businesses across a range of media, including digital real estate services, subscription video services in Australia, news and information services and book publishing, that are distributed under various brands, including The Wall Street Journal, Barron's, Dow Jones, The Australian, Herald Sun, The Sun, The Times, HarperCollins Publishers, Foxtel, FOX SPORTS Australia, realestate.com.au, Realtor.com®, talkSPORT, and OPIS, among others. Co. distributes its content and products and services to consumers.

When researching a stock like News Corp, many investors are the most familiar with Fundamental Analysis — looking at a company's balance sheet, earnings, revenues, and what's happening in that company's underlying business. Investors who use Fundamental Analysis to identify good stocks to buy or sell can also benefit from NWSA Technical Analysis to help find a good entry or exit point. Technical Analysis is blind to the fundamentals and looks only at the trading data for NWSA stock — the real life supply and demand for the stock over time — and examines that data in different ways.
10 Most Oversold S&P 500 Stocks
10 Most Overbought S&P 500 Stocks

10 ETFs With Stocks Insiders Are Buying
10 ETFs With Most Upside To Targets
The DividendRank Top 25
Warren Buffett Dividend Stocks
10 Cheap Dividend Stocks Under $10
10 Top DividendRank'ed Energy Stocks
The 10 Highest Yielding Preferred Stocks
The 15 Most Active S&P Call & Put Options
NWSA DMANWSA MACD
Video: Technical Analysis


If the video does not load after a few moments, Upgrade to the Latest Flash Player.
News Corp (NWSA) is categorized under the Services sector; to help you further research Technical Analysis, below are some other companies in the same sector:

OMC Technical Analysis
ORLY Technical Analysis
PARA Technical Analysis
PHM Technical Analysis
ROL Technical Analysis
ROST Technical Analysis
SBUX Technical Analysis
SYY Technical Analysis
TGT Technical Analysis
TJX Technical Analysis
More Services companies »


NWSA Technical Analysis | www.TechnicalAnalysisChannel.com | Copyright © 2019 - 2024, All Rights Reserved

Nothing in TechnicalAnalysisChannel.com is intended to be investment advice, nor does it represent the opinion of, counsel from, or recommendations by BNK Invest Inc. or any of its affiliates, subsidiaries or partners. None of the information contained herein constitutes a recommendation that any particular security, portfolio, transaction, or investment strategy is suitable for any specific person. All viewers agree that under no circumstances will BNK Invest, Inc,. its subsidiaries, partners, officers, employees, affiliates, or agents be held liable for any loss or damage caused by your reliance on information obtained. By visiting, using or viewing this site, you agree to the following Full Disclaimer & Terms of Use and Privacy Policy. Video widget and market videos powered by Market News Video. Quote and option data delayed at least 15 minutes; stock quote data powered by Ticker Technologies, and Mergent.
X
Wait! Don't leave yet.
Want to receive our latest research absolutely free?


Click the button below for your complimentary copy of Your Early Retirement Portfolio: Dividends Up to 8.7%—Every Month—Forever.

You'll discover the details on 4 stocks and funds that pay you massive dividends as high as 8.7%.