| PYPL Technical Analysis Data | ||||||||||||||||
Also see: |
| PYPL Current Stock Quote |
Get Dividend Alerts Get SEC Filing Alerts |
| PYPL Stock Price Chart |


| PYPL Technical Analysis Data | ||||||||||||||||
Also see: |
| PYPL Current Stock Quote |
Get Dividend Alerts Get SEC Filing Alerts |
| PYPL Stock Price Chart |
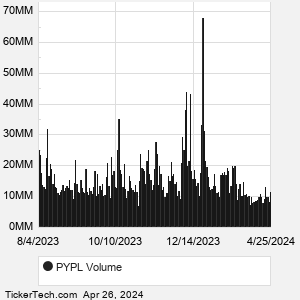
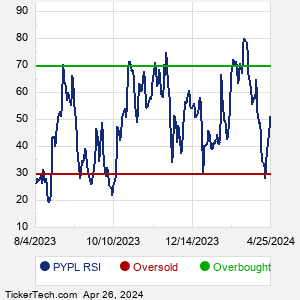
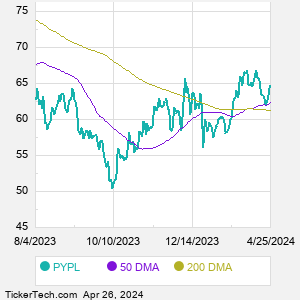
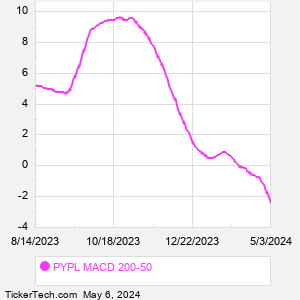
| PYPL Technical Analysis Charts |
  |
| About PayPal Holdings Inc |
| PayPal Holdings is a technology platform that enables digital payments on behalf of merchants and consumers worldwide. Co.'s payment solutions enable its customers to send and receive payments. Co. operates a global, two-sided network at scale that connects merchants and consumers with various active accounts across various markets. Co. helps merchants and consumers connect, transact, and complete payments, whether they are online or in person. Co. provides proprietary payment solutions accepted by merchants that enable the completion of payments on its payments platform on behalf of its customers. Co. enables consumers to exchange funds with merchants using a variety of funding sources. When researching a stock like PayPal Holdings, many investors are the most familiar with Fundamental Analysis — looking at a company's balance sheet, earnings, revenues, and what's happening in that company's underlying business. Investors who use Fundamental Analysis to identify good stocks to buy or sell can also benefit from PYPL Technical Analysis to help find a good entry or exit point. Technical Analysis is blind to the fundamentals and looks only at the trading data for PYPL stock — the real life supply and demand for the stock over time — and examines that data in different ways. |
| PYPL Technical Analysis Charts |
  |
| Video: Technical Analysis | |
|
| PYPL Technical Analysis Peers |
| PayPal Holdings (PYPL) is categorized under the Industrials sector; to help you further research Technical Analysis, below are some other companies in the same sector:
RHI Technical Analysis |
Click the button below for your complimentary copy of Your Early Retirement Portfolio: Dividends Up to 8.7%—Every Month—Forever.
You'll discover the details on 4 stocks and funds that pay you massive dividends as high as 8.7%.