Revvity Technical Analysis


As of date:4/23/2024
RVTY stock price:103.50
RVTY 50 DMA:104.65
RVTY 200 DMA:106.16
RVTY MACD (200-50):1.51
RVTY RSI:52.26
Extremely
Overbought
Overbought/Oversold RSI Range
RSI Indicator (Relative Strength Index)52.26
Extremely
Oversold

Also see:
RVTY Market Cap History
RVTY Shares Outstanding History
RVTY YTD Return

Quotes delayed 20 minutes

Email EnvelopeFree RVTY Email Alerts:
Get Dividend Alerts
Get SEC Filing Alerts

Notable Two Hundred Day Moving Average Cross - FTV
5 minutes ago


Notable Two Hundred Day Moving Average Cross - DEI
5 minutes ago


Bunge Global Breaks Below 200-Day Moving Average - Notable for BG
5 minutes ago


United Microelectronics Corp (UMC) Shares Cross Above 200 DMA
5 minutes ago


EQT Corp Breaks Above 200-Day Moving Average - Bullish for EQT
6 minutes ago


Molson Coors Beverage Co Breaks Below 200-Day Moving Average - Notable for TAP
6 minutes ago


IAGG Crosses Below Key Moving Average Level
6 minutes ago


WisdomTree Floating Rate Treasury Fund (USFR) Shares Cross Below 200 DMA
6 minutes ago


Notable Two Hundred Day Moving Average Cross - HD
6 minutes ago


China Consumer (CHIQ) Shares Cross Above 200 DMA
6 minutes ago


Bullish Two Hundred Day Moving Average Cross - FXI
7 minutes ago


Confluent Breaks Above 200-Day Moving Average - Bullish for CFLT
18 hours, 16 minutes ago


OLLI Makes Bullish Cross Above Critical Moving Average
18 hours, 36 minutes ago


Bullish Two Hundred Day Moving Average Cross - AY
18 hours, 37 minutes ago


Calamos Convertible and High Income Fund (CHY) Shares Cross Above 200 DMA
18 hours, 42 minutes ago


More Technical Analysis News

RVTY Technical AnalysisRVTY RSI
Revvity provides products, services and solutions for the diagnostics, life sciences and applied markets. Co. ‘s segments are: Discovery and Analytical Solutions and Diagnostics. Co.'s Discovery and Analytical Solutions segment serves: the life sciences, which consist of the life sciences research market and laboratory services market; and applied markets, which consist of environmental, food and industrial markets. Co.'s Diagnostics segment provides instruments, reagents, assay platforms, and software to hospitals, medical labs, clinicians and medical research personnel. Co.'s Diagnostics segment is focused on reproductive health, immunodiagnostics, diagnostics and applied genomics.

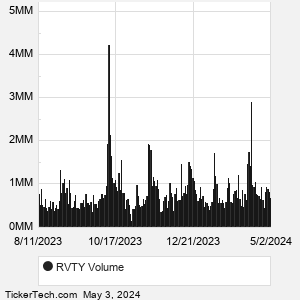
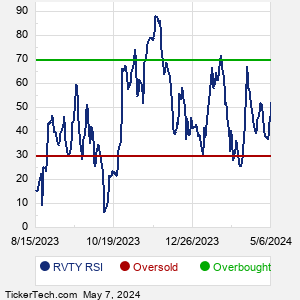
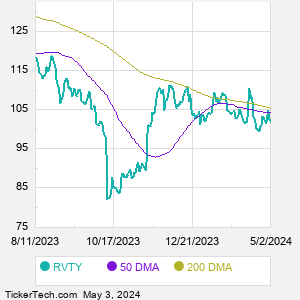
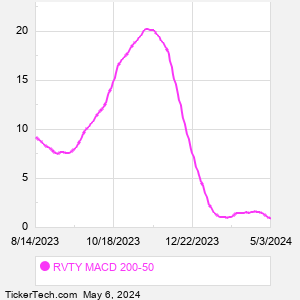
When researching a stock like Revvity, many investors are the most familiar with Fundamental Analysis — looking at a company's balance sheet, earnings, revenues, and what's happening in that company's underlying business. Investors who use Fundamental Analysis to identify good stocks to buy or sell can also benefit from RVTY Technical Analysis to help find a good entry or exit point. Technical Analysis is blind to the fundamentals and looks only at the trading data for RVTY stock — the real life supply and demand for the stock over time — and examines that data in different ways.
10 Most Oversold S&P 500 Stocks
10 Most Overbought S&P 500 Stocks

10 ETFs With Stocks Insiders Are Buying
10 ETFs With Most Upside To Targets
The DividendRank Top 25
Warren Buffett Dividend Stocks
10 Cheap Dividend Stocks Under $10
10 Top DividendRank'ed Energy Stocks
The 10 Highest Yielding Preferred Stocks
The 15 Most Active S&P Call & Put Options
RVTY DMARVTY MACD
Video: Technical Analysis


If the video does not load after a few moments, Upgrade to the Latest Flash Player.
Revvity (RVTY) is categorized under the Healthcare sector; to help you further research Technical Analysis, below are some other companies in the same sector:

STE Technical Analysis
SYK Technical Analysis
TECH Technical Analysis
TFX Technical Analysis
TMO Technical Analysis
UHS Technical Analysis
VRTX Technical Analysis
VTRS Technical Analysis
WAT Technical Analysis
WST Technical Analysis
More Healthcare companies »


Revvity Technical Analysis | www.TechnicalAnalysisChannel.com | Copyright © 2019 - 2024, All Rights Reserved

Nothing in TechnicalAnalysisChannel.com is intended to be investment advice, nor does it represent the opinion of, counsel from, or recommendations by BNK Invest Inc. or any of its affiliates, subsidiaries or partners. None of the information contained herein constitutes a recommendation that any particular security, portfolio, transaction, or investment strategy is suitable for any specific person. All viewers agree that under no circumstances will BNK Invest, Inc,. its subsidiaries, partners, officers, employees, affiliates, or agents be held liable for any loss or damage caused by your reliance on information obtained. By visiting, using or viewing this site, you agree to the following Full Disclaimer & Terms of Use and Privacy Policy. Video widget and market videos powered by Market News Video. Quote and option data delayed at least 15 minutes; stock quote data powered by Ticker Technologies, and Mergent.
X
Wait! Don't leave yet.
Want to receive our latest research absolutely free?


Click the button below for your complimentary copy of Your Early Retirement Portfolio: Dividends Up to 8.7%—Every Month—Forever.

You'll discover the details on 4 stocks and funds that pay you massive dividends as high as 8.7%.