Steel Dynamics Technical Analysis


As of date:2/13/2025
STLD stock price:132.88
STLD 50 DMA:125.09
STLD 200 DMA:126.72
STLD MACD (200-50):1.63
STLD RSI:67.31
Extremely
Overbought
Overbought/Oversold RSI Range
RSI Indicator (Relative Strength Index)67.31
Extremely
Oversold

Also see:
STLD Market Cap History
STLD Shares Outstanding History
STLD YTD Return

Quotes delayed 20 minutes

Email EnvelopeFree STLD Email Alerts:
Get Dividend Alerts
Get SEC Filing Alerts

UEC Crosses Below Key Moving Average Level
30 minutes ago


DRS Makes Notable Cross Below Critical Moving Average
31 minutes ago


RGC Resources (RGCO) Shares Cross Below 200 DMA
31 minutes ago


Notable Two Hundred Day Moving Average Cross - DY
33 minutes ago


Notable Two Hundred Day Moving Average Cross - WKC
33 minutes ago


ZTR Crosses Below Key Moving Average Level
36 minutes ago


Nexa Resources (NEXA) Shares Enter Oversold Territory
36 minutes ago


LSAK Crosses Above Key Moving Average Level
39 minutes ago


ORN Crosses Below Key Moving Average Level
42 minutes ago


ALLY Crosses Above Key Moving Average Level
42 minutes ago


JKS Crosses Above Key Moving Average Level
44 minutes ago


Acushnet Holdings (GOLF) Shares Cross Below 200 DMA
44 minutes ago


Cadre Holdings (CDRE) Shares Cross Below 200 DMA
45 minutes ago


EMBC Makes Notable Cross Below Critical Moving Average
4 hours, 32 minutes ago


PDD Makes Bullish Cross Above Critical Moving Average
5 hours, 1 minute ago


More Technical Analysis News

STLD Technical AnalysisSTLD RSI
Steel Dynamics, Inc. is a steel producer and metal recycler in the North America. Its segments include Steel Operations, Metals Recycling Operations, Steel Fabrication Operations and Aluminum Operations. Steel Operations segment consists primarily of steelmaking and various coating operations. Metals Recycling operations segment include both ferrous and nonferrous scrap metal processing, transportation, marketing, brokerage and scrap management services, strategically located primarily in close proximity to its steel mills and other end-user scrap consumers, across the U.S., and Central and Northern Mexico.

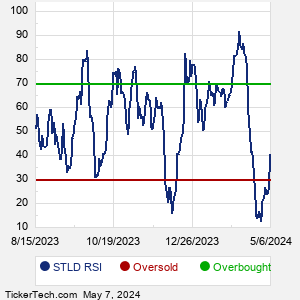
When researching a stock like Steel Dynamics, many investors are the most familiar with Fundamental Analysis — looking at a company's balance sheet, earnings, revenues, and what's happening in that company's underlying business. Investors who use Fundamental Analysis to identify good stocks to buy or sell can also benefit from STLD Technical Analysis to help find a good entry or exit point. Technical Analysis is blind to the fundamentals and looks only at the trading data for STLD stock — the real life supply and demand for the stock over time — and examines that data in different ways.
10 Most Oversold S&P 500 Stocks
10 Most Overbought S&P 500 Stocks

10 ETFs With Stocks Insiders Are Buying
10 ETFs With Most Upside To Targets
The DividendRank Top 25
Warren Buffett Dividend Stocks
10 Cheap Dividend Stocks Under $10
10 Top DividendRank'ed Energy Stocks
The 10 Highest Yielding Preferred Stocks
The 15 Most Active S&P Call & Put Options
STLD DMASTLD MACD
Video: Technical Analysis


If the video does not load after a few moments, Upgrade to the Latest Flash Player.
Steel Dynamics (STLD) is categorized under the Materials sector; to help you further research Technical Analysis, below are some other companies in the same sector:

VMC Technical Analysis
ALB Technical Analysis
APD Technical Analysis
AVY Technical Analysis
BALL Technical Analysis
BG Technical Analysis
BLDR Technical Analysis
CARR Technical Analysis
CE Technical Analysis
CF Technical Analysis
More Materials companies »


Steel Dynamics Technical Analysis | www.TechnicalAnalysisChannel.com | Copyright © 2019 - 2025, All Rights Reserved

Nothing in TechnicalAnalysisChannel.com is intended to be investment advice, nor does it represent the opinion of, counsel from, or recommendations by BNK Invest Inc. or any of its affiliates, subsidiaries or partners. None of the information contained herein constitutes a recommendation that any particular security, portfolio, transaction, or investment strategy is suitable for any specific person. All viewers agree that under no circumstances will BNK Invest, Inc,. its subsidiaries, partners, officers, employees, affiliates, or agents be held liable for any loss or damage caused by your reliance on information obtained. By visiting, using or viewing this site, you agree to the following Full Disclaimer & Terms of Use and Privacy Policy. Video widget and market videos powered by Market News Video. Quote and option data delayed at least 15 minutes; stock quote data powered by Ticker Technologies, and Mergent.
X
Wait! Don't leave yet.
Want to receive our latest research absolutely free?


Click the button below for your complimentary copy of Your Early Retirement Portfolio: Dividends Up to 8.3%—Every Month—Forever.

You'll discover the details on 4 stocks and funds that pay you massive dividends as high as 8.3%.