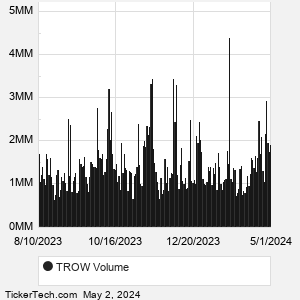
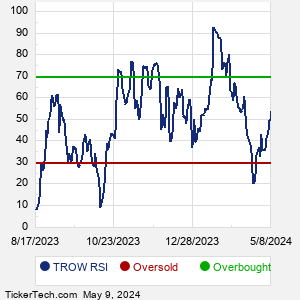
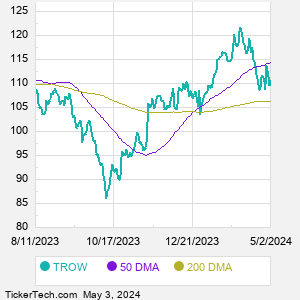
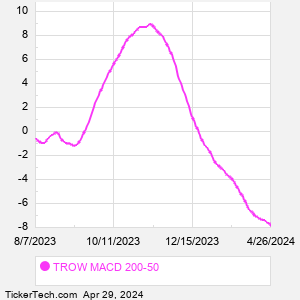
T. Rowe Price Group Technical Analysis


As of date:4/12/2024
TROW stock price:115.19
TROW 50 DMA:113.51
TROW 200 DMA:106.32
TROW MACD (200-50):-7.19
TROW RSI:41.65
Extremely
Overbought
Overbought/Oversold RSI Range
RSI Indicator (Relative Strength Index)41.65
Extremely
Oversold

Also see:
TROW Market Cap History
TROW Shares Outstanding History
TROW YTD Return

Quotes delayed 20 minutes

Email EnvelopeFree TROW Email Alerts:
Get Dividend Alerts
Get SEC Filing Alerts

iShares Cybersecurity and Tech Getting Very Oversold
54 minutes ago


PFFV Crosses Critical Technical Indicator
55 minutes ago


SPDR S&P Insurance Getting Very Oversold
55 minutes ago


Invesco CEF Income Composite Getting Very Oversold
55 minutes ago


GBF Crosses Critical Technical Indicator
55 minutes ago


PFLD Enters Oversold Territory
55 minutes ago


PFFA Enters Oversold Territory
56 minutes ago


SPDR Dow Jones Industrial Average Trust Getting Very Oversold
56 minutes ago


Notable Two Hundred Day Moving Average Cross - VEEV
57 minutes ago


WisdomTree Cloud Computing Fund (WCLD) Shares Cross Below 200 DMA
57 minutes ago


BlackRock Debt Strategies Fund (DSU) Shares Cross Below 200 DMA
57 minutes ago


CLOU Makes Notable Cross Below Critical Moving Average
57 minutes ago


AUB Makes Notable Cross Below Critical Moving Average
57 minutes ago


RAMP Crosses Below Key Moving Average Level
57 minutes ago


TSLX Makes Notable Cross Below Critical Moving Average
57 minutes ago


More Technical Analysis News

TROW Technical AnalysisTROW RSI
T. Rowe Price Group is a holding company. Through its subsidiaries, Co. provides global investment management services. Co. provides U.S. mutual funds, subadvised funds, separately managed accounts, collective investment trusts, and other T. Rowe Price products. The other T. Rowe Price products include: open-ended investment products provided to investors outside the U.S. and products provided through variable annuity life insurance plans in the U.S. Co. also provides certain investment advisory clients with related administrative services, including distribution, mutual fund transfer agent, accounting, and shareholder services; trust services; and non-discretionary advisory services.

When researching a stock like T. Rowe Price Group, many investors are the most familiar with Fundamental Analysis — looking at a company's balance sheet, earnings, revenues, and what's happening in that company's underlying business. Investors who use Fundamental Analysis to identify good stocks to buy or sell can also benefit from TROW Technical Analysis to help find a good entry or exit point. Technical Analysis is blind to the fundamentals and looks only at the trading data for TROW stock — the real life supply and demand for the stock over time — and examines that data in different ways.
10 Most Oversold S&P 500 Stocks
10 Most Overbought S&P 500 Stocks

10 ETFs With Stocks Insiders Are Buying
10 ETFs With Most Upside To Targets
The DividendRank Top 25
Warren Buffett Dividend Stocks
10 Cheap Dividend Stocks Under $10
10 Top DividendRank'ed Energy Stocks
The 10 Highest Yielding Preferred Stocks
The 15 Most Active S&P Call & Put Options
TROW DMATROW MACD
Video: Technical Analysis


If the video does not load after a few moments, Upgrade to the Latest Flash Player.
T. Rowe Price Group (TROW) is categorized under the Financials sector; to help you further research Technical Analysis, below are some other companies in the same sector:

TRV Technical Analysis
UDR Technical Analysis
UNH Technical Analysis
USB Technical Analysis
VICI Technical Analysis
VTR Technical Analysis
WELL Technical Analysis
WFC Technical Analysis
WRB Technical Analysis
WY Technical Analysis
More Financials companies »


T. Rowe Price Group Technical Analysis | www.TechnicalAnalysisChannel.com | Copyright © 2019 - 2024, All Rights Reserved

Nothing in TechnicalAnalysisChannel.com is intended to be investment advice, nor does it represent the opinion of, counsel from, or recommendations by BNK Invest Inc. or any of its affiliates, subsidiaries or partners. None of the information contained herein constitutes a recommendation that any particular security, portfolio, transaction, or investment strategy is suitable for any specific person. All viewers agree that under no circumstances will BNK Invest, Inc,. its subsidiaries, partners, officers, employees, affiliates, or agents be held liable for any loss or damage caused by your reliance on information obtained. By visiting, using or viewing this site, you agree to the following Full Disclaimer & Terms of Use and Privacy Policy. Video widget and market videos powered by Market News Video. Quote and option data delayed at least 15 minutes; stock quote data powered by Ticker Technologies, and Mergent.
X
Wait! Don't leave yet.
Want to receive our latest research absolutely free?


Click the button below for your complimentary copy of Your Early Retirement Portfolio: Dividends Up to 8.7%—Every Month—Forever.

You'll discover the details on 4 stocks and funds that pay you massive dividends as high as 8.7%.