| T Technical Analysis Data | ||||||||||||||||
Also see: |
| T Current Stock Quote |
Quotes delayed 20 minutes Get Dividend Alerts Get SEC Filing Alerts |
| T Stock Price Chart |
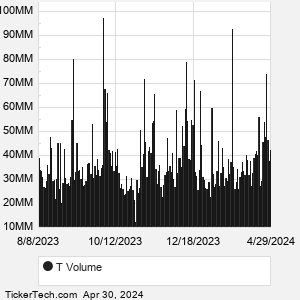
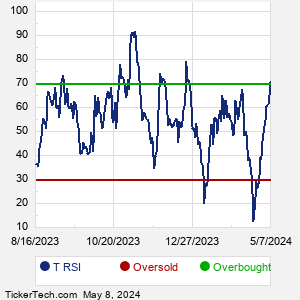
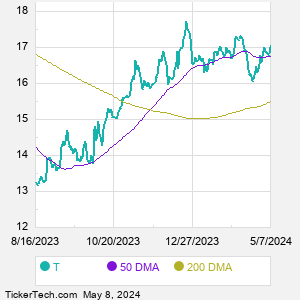
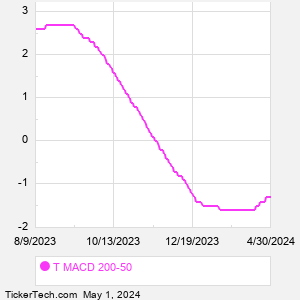
T technical analysis is shown as of 9/10/2026, with AT and T trading at 25.55. This page summarizes key technical indicators including RSI, MACD, moving averages, and recent price momentum. Investors often use these indicators together to evaluate trend direction, overbought or oversold conditions, possible momentum shifts, and support or resistance areas.

| T Technical Analysis Data | ||||||||||||||||
Also see: |
| T Current Stock Quote |
Quotes delayed 20 minutes Get Dividend Alerts Get SEC Filing Alerts |
| T Stock Price Chart |
| T Technical Analysis Charts |
![]() ![]() |
| About AT&T Inc |
| AT&T Inc. is a holding company. Co. is a provider of telecommunications and technology services globally. Co. operates through two segments: Communications and Latin America. The Communications segment provides wireless and wireline telecom and broadband services to consumers located in the U.S. and businesses globally. The business units of the Communication segment include Mobility, Business Wireline and Consumer Wireline. Mobility provides nationwide wireless service and equipment. Business Wireline provides advanced ethernet-based fiber services, IP Voice and managed professional services, as well as traditional voice and data services and related equipment to business customers. When researching a stock like AT and T, many investors are the most familiar with Fundamental Analysis — looking at a company's balance sheet, earnings, revenues, and what's happening in that company's underlying business. Investors who use Fundamental Analysis to identify good stocks to buy or sell can also benefit from T Technical Analysis to help find a good entry or exit point. Technical Analysis is blind to the fundamentals and looks only at the trading data for T stock — the real life supply and demand for the stock over time — and examines that data in different ways. |
| T Technical Analysis Charts |
![]() ![]() |
| Video: Technical Analysis | |
|
| T Technical Analysis Peers |
| AT and T (T) is categorized under the Technology sector; to help you further research Technical Analysis, below are some other companies in the same sector:
TDY Technical Analysis TER Technical Analysis TMUS Technical Analysis TRMB Technical Analysis TTWO Technical Analysis TXN Technical Analysis TYL Technical Analysis UBER Technical Analysis VEEV Technical Analysis VRSN Technical Analysis More Technology companies » |
Click the button below for your complimentary copy of Your Early Retirement Portfolio: Dividends Up to 8.7%—Every Month—Forever.
You'll discover the details on 4 stocks and funds that pay you massive dividends as high as 8.7%.