| TFX Technical Analysis Data | ||||||||||||||||
Also see: |
| TFX Current Stock Quote |
Get Dividend Alerts Get SEC Filing Alerts |
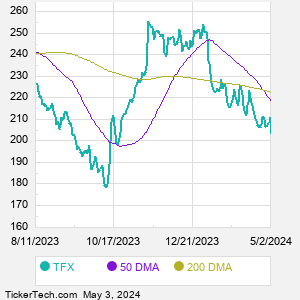
| TFX Stock Price Chart |


| TFX Technical Analysis Data | ||||||||||||||||
Also see: |
| TFX Current Stock Quote |
Get Dividend Alerts Get SEC Filing Alerts |
| TFX Stock Price Chart |
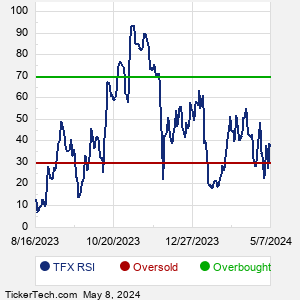
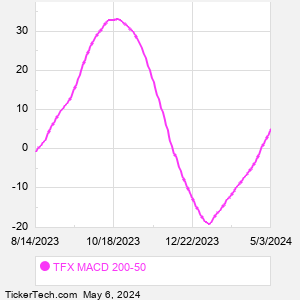
| TFX Technical Analysis Charts |
  |
| About Teleflex Incorporated |
| Teleflex is a global provider of medical technology products. Co. primarily designs, develops, manufactures and supplies single-use medical devices used by hospitals and healthcare providers for common diagnostic and therapeutic procedures in critical care and surgical applications. Co. has four segments: Americas, Europe, the Middle East and Africa, Asia Pacific and Original Equipment Manufacturer and Development Services (OEM). Each of Co.'s three geographic segments provides a portfolio of medical technology products used by hospitals and healthcare providers. Co.'s OEM segment designs, manufactures and supplies devices and instruments for other medical device manufacturers. When researching a stock like Teleflexorporated, many investors are the most familiar with Fundamental Analysis — looking at a company's balance sheet, earnings, revenues, and what's happening in that company's underlying business. Investors who use Fundamental Analysis to identify good stocks to buy or sell can also benefit from TFX Technical Analysis to help find a good entry or exit point. Technical Analysis is blind to the fundamentals and looks only at the trading data for TFX stock — the real life supply and demand for the stock over time — and examines that data in different ways. |
| TFX Technical Analysis Charts |
  |
| Video: Technical Analysis | |
|
| TFX Technical Analysis Peers |
| Teleflexorporated (TFX) is categorized under the Healthcare sector; to help you further research Technical Analysis, below are some other companies in the same sector:
TMO Technical Analysis |
Click the button below for your complimentary copy of Your Early Retirement Portfolio: Dividends Up to 8.7%—Every Month—Forever.
You'll discover the details on 4 stocks and funds that pay you massive dividends as high as 8.7%.