TransDigm Group Technical Analysis


As of date:4/23/2024
TDG stock price:1242.40
TDG 50 DMA:1193.99
TDG 200 DMA:979.88
TDG MACD (200-50):-214.11
TDG RSI:53.00
Extremely
Overbought
Overbought/Oversold RSI Range
RSI Indicator (Relative Strength Index)53.00
Extremely
Oversold

Also see:
TDG Market Cap History
TDG Shares Outstanding History
TDG YTD Return

Quotes delayed 20 minutes

Email EnvelopeFree TDG Email Alerts:
Get Dividend Alerts
Get SEC Filing Alerts

Notable Two Hundred Day Moving Average Cross - BVS
15 minutes ago


LOVE Crosses Above Key Moving Average Level
15 minutes ago


AUTL Makes Notable Cross Below Critical Moving Average
15 minutes ago


BILI Crosses Above Key Moving Average Level
16 minutes ago


KalVista Pharmaceuticals Breaks Below 200-Day Moving Average - Notable for KALV
16 minutes ago


OCUL Makes Notable Cross Below Critical Moving Average
16 minutes ago


United Community Banks Breaks Above 200-Day Moving Average - Bullish for UCBI
20 minutes ago


FMNB Makes Bullish Cross Above Critical Moving Average
21 minutes ago


Notable Two Hundred Day Moving Average Cross - MANH
58 minutes ago


Healthcare Services Group (HCSG) Shares Cross Below 200 DMA
59 minutes ago


Mattel (MAT) Shares Cross Above 200 DMA
59 minutes ago


Notable Two Hundred Day Moving Average Cross - FTV
1 hour, 15 minutes ago


Notable Two Hundred Day Moving Average Cross - DEI
1 hour, 15 minutes ago


Bunge Global Breaks Below 200-Day Moving Average - Notable for BG
1 hour, 15 minutes ago


United Microelectronics Corp (UMC) Shares Cross Above 200 DMA
1 hour, 15 minutes ago


More Technical Analysis News

TDG Technical AnalysisTDG RSI
TransDigm Group is a holding company. Through its subsidiary, TransDigm Inc., Co. is a designer, producer and supplier of aircraft components for use on commercial and military aircraft. Co.'s segments are: Power and Control, which develops, produces and markets systems and components that predominately provide power to or control power of the aircraft utilizing electronic, fluid, power and mechanical motion control technologies; Airframe, which develops, produces and markets systems and components that are used in non-power airframe applications utilizing airframe and cabin structure technologies; and Non-aviation, which develops, produces and markets products for non-aviation markets.

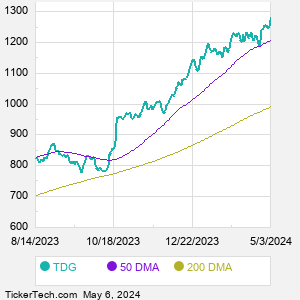
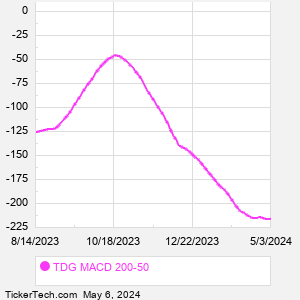
When researching a stock like TransDigm Group, many investors are the most familiar with Fundamental Analysis — looking at a company's balance sheet, earnings, revenues, and what's happening in that company's underlying business. Investors who use Fundamental Analysis to identify good stocks to buy or sell can also benefit from TDG Technical Analysis to help find a good entry or exit point. Technical Analysis is blind to the fundamentals and looks only at the trading data for TDG stock — the real life supply and demand for the stock over time — and examines that data in different ways.
10 Most Oversold S&P 500 Stocks
10 Most Overbought S&P 500 Stocks

10 ETFs With Stocks Insiders Are Buying
10 ETFs With Most Upside To Targets
The DividendRank Top 25
Warren Buffett Dividend Stocks
10 Cheap Dividend Stocks Under $10
10 Top DividendRank'ed Energy Stocks
The 10 Highest Yielding Preferred Stocks
The 15 Most Active S&P Call & Put Options
TDG DMATDG MACD
Video: Technical Analysis


If the video does not load after a few moments, Upgrade to the Latest Flash Player.
TransDigm Group (TDG) is categorized under the Industrials sector; to help you further research Technical Analysis, below are some other companies in the same sector:

TEL Technical Analysis
TXT Technical Analysis
UAL Technical Analysis
UNP Technical Analysis
UPS Technical Analysis
URI Technical Analysis
V Technical Analysis
VLTO Technical Analysis
VRSK Technical Analysis
WAB Technical Analysis
More Industrials companies »


TransDigm Group Technical Analysis | www.TechnicalAnalysisChannel.com | Copyright © 2019 - 2024, All Rights Reserved

Nothing in TechnicalAnalysisChannel.com is intended to be investment advice, nor does it represent the opinion of, counsel from, or recommendations by BNK Invest Inc. or any of its affiliates, subsidiaries or partners. None of the information contained herein constitutes a recommendation that any particular security, portfolio, transaction, or investment strategy is suitable for any specific person. All viewers agree that under no circumstances will BNK Invest, Inc,. its subsidiaries, partners, officers, employees, affiliates, or agents be held liable for any loss or damage caused by your reliance on information obtained. By visiting, using or viewing this site, you agree to the following Full Disclaimer & Terms of Use and Privacy Policy. Video widget and market videos powered by Market News Video. Quote and option data delayed at least 15 minutes; stock quote data powered by Ticker Technologies, and Mergent.
X
Wait! Don't leave yet.
Want to receive our latest research absolutely free?


Click the button below for your complimentary copy of Your Early Retirement Portfolio: Dividends Up to 8.7%—Every Month—Forever.

You'll discover the details on 4 stocks and funds that pay you massive dividends as high as 8.7%.