Truist Financial Technical Analysis


As of date:2/13/2025
TFC stock price:46.46
TFC 50 DMA:45.70
TFC 200 DMA:42.09
TFC MACD (200-50):-3.61
TFC RSI:45.73
Extremely
Overbought
Overbought/Oversold RSI Range
RSI Indicator (Relative Strength Index)45.73
Extremely
Oversold

Also see:
TFC Market Cap History
TFC Shares Outstanding History
TFC YTD Return

Quotes delayed 20 minutes

Email EnvelopeFree TFC Email Alerts:
Get Dividend Alerts
Get SEC Filing Alerts

UEC Crosses Below Key Moving Average Level
30 minutes ago


DRS Makes Notable Cross Below Critical Moving Average
31 minutes ago


RGC Resources (RGCO) Shares Cross Below 200 DMA
31 minutes ago


Notable Two Hundred Day Moving Average Cross - DY
33 minutes ago


Notable Two Hundred Day Moving Average Cross - WKC
33 minutes ago


ZTR Crosses Below Key Moving Average Level
36 minutes ago


Nexa Resources (NEXA) Shares Enter Oversold Territory
36 minutes ago


LSAK Crosses Above Key Moving Average Level
39 minutes ago


ORN Crosses Below Key Moving Average Level
42 minutes ago


ALLY Crosses Above Key Moving Average Level
42 minutes ago


JKS Crosses Above Key Moving Average Level
44 minutes ago


Acushnet Holdings (GOLF) Shares Cross Below 200 DMA
44 minutes ago


Cadre Holdings (CDRE) Shares Cross Below 200 DMA
45 minutes ago


EMBC Makes Notable Cross Below Critical Moving Average
4 hours, 32 minutes ago


PDD Makes Bullish Cross Above Critical Moving Average
5 hours, 1 minute ago


More Technical Analysis News

TFC Technical AnalysisTFC RSI
Truist Financial Corporation is a financial services company. Co. operates through its commercial bank subsidiary, Truist Bank (the Bank). The Bank provides a range of banking and trust services for clients and its digital platform. Co.'s segments include Consumer Banking and Wealth, Corporate and Commercial Banking, and Insurance Holdings. The Bank provides a range of banking services to commercial and consumer clients, which includes asset management, automobile lending, credit card lending, consumer finance, home equity lending, insurance, investment brokerage services, mobile/online banking, payment solutions, retail deposit products, small business lending and student lending.

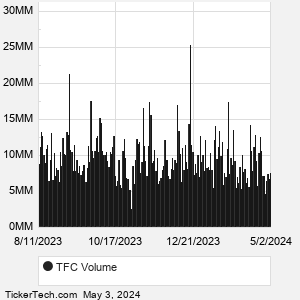
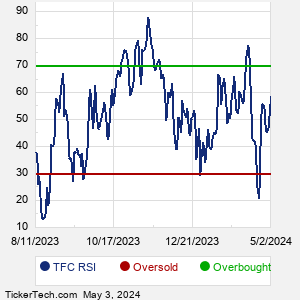
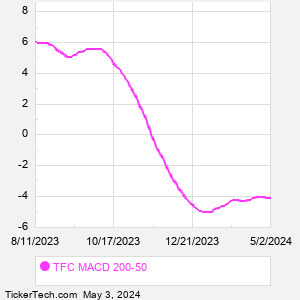
When researching a stock like Truist Financial, many investors are the most familiar with Fundamental Analysis — looking at a company's balance sheet, earnings, revenues, and what's happening in that company's underlying business. Investors who use Fundamental Analysis to identify good stocks to buy or sell can also benefit from TFC Technical Analysis to help find a good entry or exit point. Technical Analysis is blind to the fundamentals and looks only at the trading data for TFC stock — the real life supply and demand for the stock over time — and examines that data in different ways.
10 Most Oversold S&P 500 Stocks
10 Most Overbought S&P 500 Stocks

10 ETFs With Stocks Insiders Are Buying
10 ETFs With Most Upside To Targets
The DividendRank Top 25
Warren Buffett Dividend Stocks
10 Cheap Dividend Stocks Under $10
10 Top DividendRank'ed Energy Stocks
The 10 Highest Yielding Preferred Stocks
The 15 Most Active S&P Call & Put Options
TFC DMATFC MACD
Video: Technical Analysis


If the video does not load after a few moments, Upgrade to the Latest Flash Player.
Truist Financial (TFC) is categorized under the Financials sector; to help you further research Technical Analysis, below are some other companies in the same sector:

TPL Technical Analysis
TROW Technical Analysis
TRV Technical Analysis
UDR Technical Analysis
UNH Technical Analysis
USB Technical Analysis
VICI Technical Analysis
VTR Technical Analysis
WELL Technical Analysis
WFC Technical Analysis
More Financials companies »


Truist Financial Technical Analysis | www.TechnicalAnalysisChannel.com | Copyright © 2019 - 2025, All Rights Reserved

Nothing in TechnicalAnalysisChannel.com is intended to be investment advice, nor does it represent the opinion of, counsel from, or recommendations by BNK Invest Inc. or any of its affiliates, subsidiaries or partners. None of the information contained herein constitutes a recommendation that any particular security, portfolio, transaction, or investment strategy is suitable for any specific person. All viewers agree that under no circumstances will BNK Invest, Inc,. its subsidiaries, partners, officers, employees, affiliates, or agents be held liable for any loss or damage caused by your reliance on information obtained. By visiting, using or viewing this site, you agree to the following Full Disclaimer & Terms of Use and Privacy Policy. Video widget and market videos powered by Market News Video. Quote and option data delayed at least 15 minutes; stock quote data powered by Ticker Technologies, and Mergent.
X
Wait! Don't leave yet.
Want to receive our latest research absolutely free?


Click the button below for your complimentary copy of Your Early Retirement Portfolio: Dividends Up to 8.3%—Every Month—Forever.

You'll discover the details on 4 stocks and funds that pay you massive dividends as high as 8.3%.