TSLA Technical Analysis


As of date:1/16/2025
TSLA stock price:413.82
TSLA 50 DMA:377.54
TSLA 200 DMA:250.24
TSLA MACD (200-50):-127.30
TSLA RSI:37.51
Extremely
Overbought
Overbought/Oversold RSI Range
RSI Indicator (Relative Strength Index)37.51
Extremely
Oversold

Also see:
TSLA Market Cap History
TSLA Shares Outstanding History
TSLA YTD Return

Quotes delayed 20 minutes

Email EnvelopeFree TSLA Email Alerts:
Get Dividend Alerts
Get SEC Filing Alerts

PLPC Makes Bullish Cross Above Critical Moving Average
1 hour, 27 minutes ago


TXO Crosses Above Key Moving Average Level
1 hour, 32 minutes ago


TD Makes Bullish Cross Above Critical Moving Average
1 hour, 45 minutes ago


TD Makes Bullish Cross Above Critical Moving Average
1 hour, 46 minutes ago


Sun Communities (SUI) Shares Cross Above 200 DMA
1 hour, 58 minutes ago


Bullish Two Hundred Day Moving Average Cross - RLY
1 hour, 58 minutes ago


Snowline Gold Breaks Above 200-Day Moving Average - Bullish for SGD.CA
1 hour, 58 minutes ago


MARA Crosses Above Key Moving Average Level
5 hours, 36 minutes ago


CHX Crosses Above Key Moving Average Level
5 hours, 49 minutes ago


Okta Breaks Above 200-Day Moving Average - Bullish for OKTA
5 hours, 49 minutes ago


CLMT Makes Notable Cross Below Critical Moving Average
5 hours, 53 minutes ago


Credit Acceptance (CACC) Shares Cross Above 200 DMA
6 hours, 17 minutes ago


PCH Makes Bullish Cross Above Critical Moving Average
6 hours, 17 minutes ago


Ferrari Breaks Above 200-Day Moving Average - Bullish for RACE
6 hours, 24 minutes ago


Vontier Breaks Above 200-Day Moving Average - Bullish for VNT
6 hours, 24 minutes ago


More Technical Analysis News

TSLA Technical AnalysisTSLA RSI
Tesla, Inc. designs, develops, manufactures, sells and leases high-performance fully electric vehicles and energy generation and storage systems, and offers services related to its products. Co.'s segments include automotive, and energy generation and storage. The automotive segment includes the design, development, manufacturing, sales and leasing of high-performance fully electric vehicles, and sales of automotive regulatory credits. It also includes sales of used vehicles, non-warranty after-sales vehicle services, body shop and parts, paid supercharging, vehicle insurance and retail merchandise. Its consumer vehicles include the Model 3, Y, S, X and Cybertruck.

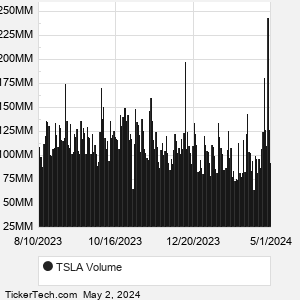
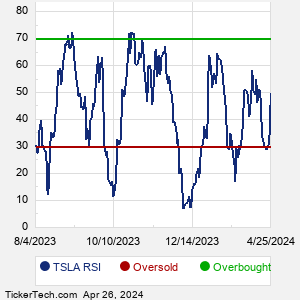
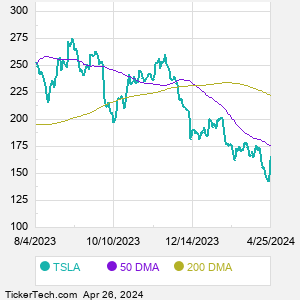
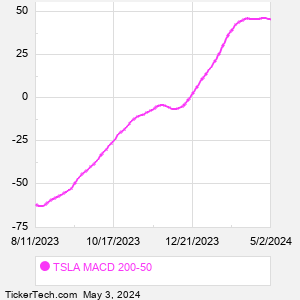
When researching a stock like Tesla, many investors are the most familiar with Fundamental Analysis — looking at a company's balance sheet, earnings, revenues, and what's happening in that company's underlying business. Investors who use Fundamental Analysis to identify good stocks to buy or sell can also benefit from TSLA Technical Analysis to help find a good entry or exit point. Technical Analysis is blind to the fundamentals and looks only at the trading data for TSLA stock — the real life supply and demand for the stock over time — and examines that data in different ways.
10 Most Oversold S&P 500 Stocks
10 Most Overbought S&P 500 Stocks

10 ETFs With Stocks Insiders Are Buying
10 ETFs With Most Upside To Targets
The DividendRank Top 25
Warren Buffett Dividend Stocks
10 Cheap Dividend Stocks Under $10
10 Top DividendRank'ed Energy Stocks
The 10 Highest Yielding Preferred Stocks
The 15 Most Active S&P Call & Put Options
TSLA DMATSLA MACD
Video: Technical Analysis


If the video does not load after a few moments, Upgrade to the Latest Flash Player.
Tesla (TSLA) is categorized under the Consumer sector; to help you further research Technical Analysis, below are some other companies in the same sector:

TSN Technical Analysis
ADM Technical Analysis
AOS Technical Analysis
BF.B Technical Analysis
BWA Technical Analysis
CAG Technical Analysis
CHD Technical Analysis
CL Technical Analysis
CLX Technical Analysis
CMI Technical Analysis
More Consumer companies »


TSLA Technical Analysis | www.TechnicalAnalysisChannel.com | Copyright © 2019 - 2025, All Rights Reserved

Nothing in TechnicalAnalysisChannel.com is intended to be investment advice, nor does it represent the opinion of, counsel from, or recommendations by BNK Invest Inc. or any of its affiliates, subsidiaries or partners. None of the information contained herein constitutes a recommendation that any particular security, portfolio, transaction, or investment strategy is suitable for any specific person. All viewers agree that under no circumstances will BNK Invest, Inc,. its subsidiaries, partners, officers, employees, affiliates, or agents be held liable for any loss or damage caused by your reliance on information obtained. By visiting, using or viewing this site, you agree to the following Full Disclaimer & Terms of Use and Privacy Policy. Video widget and market videos powered by Market News Video. Quote and option data delayed at least 15 minutes; stock quote data powered by Ticker Technologies, and Mergent.
X
Wait! Don't leave yet.
Want to receive our latest research absolutely free?


Click the button below for your complimentary copy of Your Early Retirement Portfolio: Dividends Up to 8.3%—Every Month—Forever.

You'll discover the details on 4 stocks and funds that pay you massive dividends as high as 8.3%.