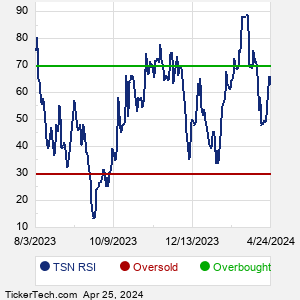
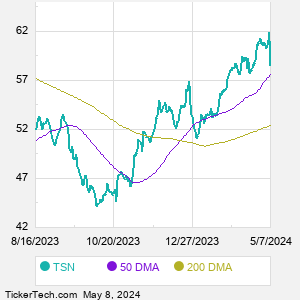
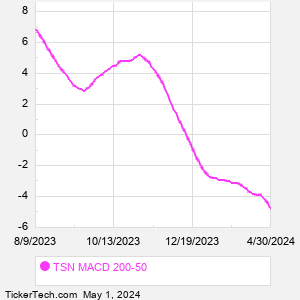
TSN Technical Analysis


As of date:4/18/2024
TSN stock price:58.87
TSN 50 DMA:55.74
TSN 200 DMA:51.87
TSN MACD (200-50):-3.87
TSN RSI:50.79
Extremely
Overbought
Overbought/Oversold RSI Range
RSI Indicator (Relative Strength Index)50.79
Extremely
Oversold

Also see:
TSN Market Cap History
TSN Shares Outstanding History
TSN YTD Return

Quotes delayed 20 minutes

Email EnvelopeFree TSN Email Alerts:
Get Dividend Alerts
Get SEC Filing Alerts

ADI Makes Notable Cross Below Critical Moving Average
just posted


Pathward Financial (CASH) Shares Cross Above 200 DMA
just posted


Premier Financial Breaks Above 200-Day Moving Average - Bullish for PFC
2 minutes ago


Shares of WINN Now Oversold
4 minutes ago


Shares of XLY Now Oversold
4 minutes ago


Shares of VUG Now Oversold
4 minutes ago


VOT Crowded With Sellers
4 minutes ago


The Technology Select Sector SPDR Fund (XLK) Enters Oversold Territory
4 minutes ago


Shares of USSG Now Oversold
4 minutes ago


AIQ Crosses Critical Technical Indicator
4 minutes ago


Shares of DRIV Now Oversold
5 minutes ago


UGIC Crosses Above Key Moving Average Level
5 minutes ago


Shares of IVOG Now Oversold
7 minutes ago


Shares of IGPT Now Oversold
7 minutes ago


First Trust Technology AlphaDEX Fund Getting Very Oversold
7 minutes ago


More Technical Analysis News

TSN Technical AnalysisTSN RSI
Tyson Foods is a food company. Co.'s operations consist of breeding stock, contract farmers, feed production, processing, further-processing, marketing and transportation of chicken and related other products, including animal and pet food ingredients. Through its wholly-owned subsidiary, Cobb-Vantress, Inc., Co. is engaged as poultry breeding stock supplier. Co. also processes live fed cattle and hogs and fabricates dressed beef and pork carcasses into primal and sub-primal meat cuts, case-ready beef and pork and fully-cooked meats. Co. produces a range of fresh, frozen and refrigerated food products. Co.'s segments include: Beef, Pork, Chicken and Prepared Foods.

When researching a stock like Tyson Foods, many investors are the most familiar with Fundamental Analysis — looking at a company's balance sheet, earnings, revenues, and what's happening in that company's underlying business. Investors who use Fundamental Analysis to identify good stocks to buy or sell can also benefit from TSN Technical Analysis to help find a good entry or exit point. Technical Analysis is blind to the fundamentals and looks only at the trading data for TSN stock — the real life supply and demand for the stock over time — and examines that data in different ways.
10 Most Oversold S&P 500 Stocks
10 Most Overbought S&P 500 Stocks

10 ETFs With Stocks Insiders Are Buying
10 ETFs With Most Upside To Targets
The DividendRank Top 25
Warren Buffett Dividend Stocks
10 Cheap Dividend Stocks Under $10
10 Top DividendRank'ed Energy Stocks
The 10 Highest Yielding Preferred Stocks
The 15 Most Active S&P Call & Put Options
TSN DMATSN MACD
Video: Technical Analysis


If the video does not load after a few moments, Upgrade to the Latest Flash Player.
Tyson Foods (TSN) is categorized under the Consumer sector; to help you further research Technical Analysis, below are some other companies in the same sector:

ADM Technical Analysis
AOS Technical Analysis
BF.B Technical Analysis
BWA Technical Analysis
CAG Technical Analysis
CHD Technical Analysis
CL Technical Analysis
CLX Technical Analysis
CMI Technical Analysis
CPB Technical Analysis
More Consumer companies »


TSN Technical Analysis | www.TechnicalAnalysisChannel.com | Copyright © 2019 - 2024, All Rights Reserved

Nothing in TechnicalAnalysisChannel.com is intended to be investment advice, nor does it represent the opinion of, counsel from, or recommendations by BNK Invest Inc. or any of its affiliates, subsidiaries or partners. None of the information contained herein constitutes a recommendation that any particular security, portfolio, transaction, or investment strategy is suitable for any specific person. All viewers agree that under no circumstances will BNK Invest, Inc,. its subsidiaries, partners, officers, employees, affiliates, or agents be held liable for any loss or damage caused by your reliance on information obtained. By visiting, using or viewing this site, you agree to the following Full Disclaimer & Terms of Use and Privacy Policy. Video widget and market videos powered by Market News Video. Quote and option data delayed at least 15 minutes; stock quote data powered by Ticker Technologies, and Mergent.
X
Wait! Don't leave yet.
Want to receive our latest research absolutely free?


Click the button below for your complimentary copy of Your Early Retirement Portfolio: Dividends Up to 8.7%—Every Month—Forever.

You'll discover the details on 4 stocks and funds that pay you massive dividends as high as 8.7%.