| TXN Technical Analysis Data | ||||||||||||||||
Also see: |
| TXN Current Stock Quote |
Get Dividend Alerts Get SEC Filing Alerts |
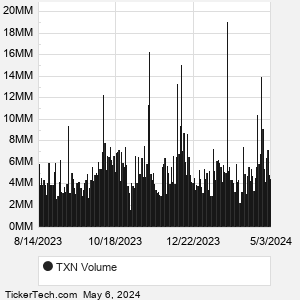
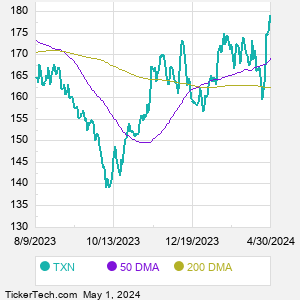
| TXN Stock Price Chart |


| TXN Technical Analysis Data | ||||||||||||||||
Also see: |
| TXN Current Stock Quote |
Get Dividend Alerts Get SEC Filing Alerts |
| TXN Stock Price Chart |
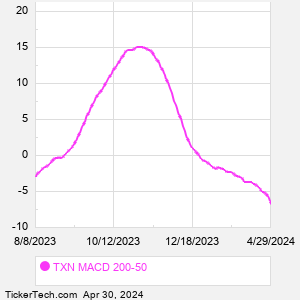
| TXN Technical Analysis Charts |
  |
| About Texas Instruments Inc. |
| Texas Instruments designs and makes semiconductors that it sells to electronics designers and manufacturers. Co.'s segments include Analog and Embedded Processing. Co.'s analog semiconductors change signals, such as sound, temperature, pressure or images, by conditioning them, amplifying them and often converting them to a stream of digital data that can be processed by other semiconductors. Co.'s embedded Processing products are designed to handle specific tasks and can be improved for various combinations of performance, power and cost, depending on the application. Co.'s Embedded Processing segment includes microcontrollers, digital signal processors and applications processors. When researching a stock like Texas Instruments, many investors are the most familiar with Fundamental Analysis — looking at a company's balance sheet, earnings, revenues, and what's happening in that company's underlying business. Investors who use Fundamental Analysis to identify good stocks to buy or sell can also benefit from TXN Technical Analysis to help find a good entry or exit point. Technical Analysis is blind to the fundamentals and looks only at the trading data for TXN stock — the real life supply and demand for the stock over time — and examines that data in different ways. |
| TXN Technical Analysis Charts |
  |
| Video: Technical Analysis | |
|
| TXN Technical Analysis Peers |
| Texas Instruments (TXN) is categorized under the Technology sector; to help you further research Technical Analysis, below are some other companies in the same sector:
TYL Technical Analysis |
Click the button below for your complimentary copy of Your Early Retirement Portfolio: Dividends Up to 8.7%—Every Month—Forever.
You'll discover the details on 4 stocks and funds that pay you massive dividends as high as 8.7%.