Walt Disney Technical Analysis


As of date:4/24/2024
DIS stock price:113.92
DIS 50 DMA:113.91
DIS 200 DMA:94.58
DIS MACD (200-50):-19.33
DIS RSI:37.87
Extremely
Overbought
Overbought/Oversold RSI Range
RSI Indicator (Relative Strength Index)37.87
Extremely
Oversold

Also see:
DIS Market Cap History
DIS Shares Outstanding History
DIS YTD Return

Quotes delayed 20 minutes

Email EnvelopeFree DIS Email Alerts:
Get Dividend Alerts
Get SEC Filing Alerts

Coastal Financial Breaks Above 200-Day Moving Average - Bullish for CCB
1 hour, 18 minutes ago


CNOB Makes Bullish Cross Above Critical Moving Average
1 hour, 19 minutes ago


Bullish Two Hundred Day Moving Average Cross - MDLZ
1 hour, 21 minutes ago


ATXS Makes Notable Cross Below Critical Moving Average
1 hour, 22 minutes ago


United States Steel Breaks Below 200-Day Moving Average - Notable for X
1 hour, 26 minutes ago


Boyd Group Services Crosses Below Key Moving Average Level
2 hours, 9 minutes ago


Notable Two Hundred Day Moving Average Cross - BVS
5 hours, 45 minutes ago


LOVE Crosses Above Key Moving Average Level
5 hours, 45 minutes ago


AUTL Makes Notable Cross Below Critical Moving Average
5 hours, 45 minutes ago


BILI Crosses Above Key Moving Average Level
5 hours, 46 minutes ago


KalVista Pharmaceuticals Breaks Below 200-Day Moving Average - Notable for KALV
5 hours, 46 minutes ago


OCUL Makes Notable Cross Below Critical Moving Average
5 hours, 46 minutes ago


United Community Banks Breaks Above 200-Day Moving Average - Bullish for UCBI
5 hours, 50 minutes ago


FMNB Makes Bullish Cross Above Critical Moving Average
5 hours, 51 minutes ago


Notable Two Hundred Day Moving Average Cross - MANH
6 hours, 28 minutes ago


More Technical Analysis News

DIS Technical AnalysisDIS RSI
Walt Disney, together with its subsidiaries, is an entertainment company with operations in two segments: Disney Media and Entertainment Distribution (DMED) and Disney Parks, Experiences and Products (DPEP). DMED encompasses Co.'s film and episodic television content production and distribution activities. Content is distributed by a single organization across three lines of business: Linear Networks, Direct-to-Consumer and Content Sales/Licensing. The operations of DPEP's lines of business are: Parks and Experiences, which consist of theme parks and resorts; and Consumer Products, which consist of licensing of its trade names, characters, visual, literary and other intellectual properties.

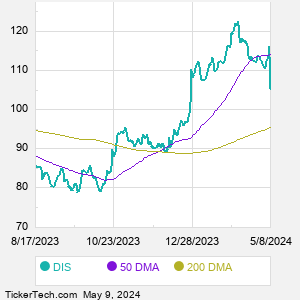
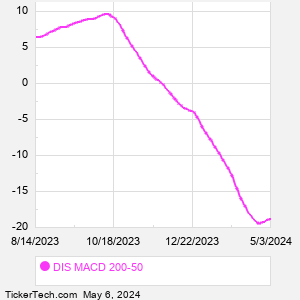
When researching a stock like Walt Disney, many investors are the most familiar with Fundamental Analysis — looking at a company's balance sheet, earnings, revenues, and what's happening in that company's underlying business. Investors who use Fundamental Analysis to identify good stocks to buy or sell can also benefit from DIS Technical Analysis to help find a good entry or exit point. Technical Analysis is blind to the fundamentals and looks only at the trading data for DIS stock — the real life supply and demand for the stock over time — and examines that data in different ways.
10 Most Oversold S&P 500 Stocks
10 Most Overbought S&P 500 Stocks

10 ETFs With Stocks Insiders Are Buying
10 ETFs With Most Upside To Targets
The DividendRank Top 25
Warren Buffett Dividend Stocks
10 Cheap Dividend Stocks Under $10
10 Top DividendRank'ed Energy Stocks
The 10 Highest Yielding Preferred Stocks
The 15 Most Active S&P Call & Put Options
DIS DMADIS MACD
Video: Technical Analysis


If the video does not load after a few moments, Upgrade to the Latest Flash Player.
Walt Disney (DIS) is categorized under the Services sector; to help you further research Technical Analysis, below are some other companies in the same sector:

DLTR Technical Analysis
DPZ Technical Analysis
DRI Technical Analysis
EXPE Technical Analysis
FAST Technical Analysis
FOX Technical Analysis
FOXA Technical Analysis
GOOG Technical Analysis
GOOGL Technical Analysis
HD Technical Analysis
More Services companies »


Walt Disney Technical Analysis | www.TechnicalAnalysisChannel.com | Copyright © 2019 - 2024, All Rights Reserved

Nothing in TechnicalAnalysisChannel.com is intended to be investment advice, nor does it represent the opinion of, counsel from, or recommendations by BNK Invest Inc. or any of its affiliates, subsidiaries or partners. None of the information contained herein constitutes a recommendation that any particular security, portfolio, transaction, or investment strategy is suitable for any specific person. All viewers agree that under no circumstances will BNK Invest, Inc,. its subsidiaries, partners, officers, employees, affiliates, or agents be held liable for any loss or damage caused by your reliance on information obtained. By visiting, using or viewing this site, you agree to the following Full Disclaimer & Terms of Use and Privacy Policy. Video widget and market videos powered by Market News Video. Quote and option data delayed at least 15 minutes; stock quote data powered by Ticker Technologies, and Mergent.
X
Wait! Don't leave yet.
Want to receive our latest research absolutely free?


Click the button below for your complimentary copy of Your Early Retirement Portfolio: Dividends Up to 8.7%—Every Month—Forever.

You'll discover the details on 4 stocks and funds that pay you massive dividends as high as 8.7%.