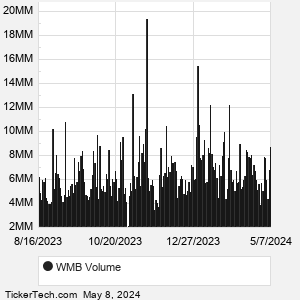
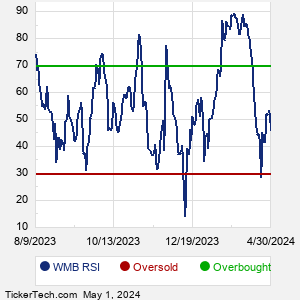
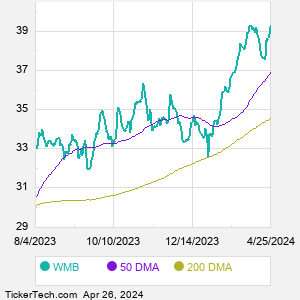
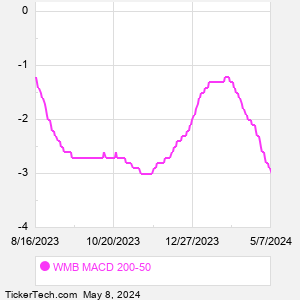
Williams Cos Technical Analysis


As of date:4/22/2024
WMB stock price:38.66
WMB 50 DMA:36.77
WMB 200 DMA:34.51
WMB MACD (200-50):-2.26
WMB RSI:41.53
Extremely
Overbought
Overbought/Oversold RSI Range
RSI Indicator (Relative Strength Index)41.53
Extremely
Oversold

Also see:
WMB Market Cap History
WMB Shares Outstanding History
WMB YTD Return

Quotes delayed 20 minutes

Email EnvelopeFree WMB Email Alerts:
Get Dividend Alerts
Get SEC Filing Alerts

COTY Crosses Above Key Moving Average Level
just posted


CRI Crosses Above Key Moving Average Level
2 minutes ago


KRG Makes Bullish Cross Above Critical Moving Average
2 minutes ago


Quest Diagnostics (DGX) Shares Cross Above 200 DMA
5 minutes ago


SRE Crosses Above Key Moving Average Level
7 minutes ago


WTRG Makes Bullish Cross Above Critical Moving Average
10 minutes ago


FMS Crosses Above Key Moving Average Level
10 minutes ago


Simpson Manufacturing (SSD) Shares Cross Below 200 DMA
15 minutes ago


Brandywine Realty Trust (BDN) Shares Cross Above 200 DMA
15 minutes ago


DPST Makes Bullish Cross Above Critical Moving Average
15 minutes ago


First Trust Ultra Short Duration Municipal Breaks Below 200-Day Moving Average - Notable for FUMB
16 minutes ago


AGCO Shares Cross Above 200 DMA
16 minutes ago


JPMB Shares Cross Above 200 DMA
16 minutes ago


Hashicorp (HCP) Shares Cross Above 200 DMA
12 hours, 57 minutes ago


EE Crosses Above Key Moving Average Level
18 hours, 44 minutes ago


More Technical Analysis News

WMB Technical AnalysisWMB RSI
Williams Companies is an energy company, providing infrastructure that delivers natural gas products to fuel the clean energy economy. Co.'s segments are: Transmission & Gulf of Mexico, which includes Co.'s subsidiary, Transcontinental Gas Pipe Line Company, LLC, an interstate natural gas pipeline that extends from the Gulf of Mexico to the eastern seaboard; Northeast G&P, which is comprised of Co.'s midstream gathering, processing, and fractionation businesses; West, which is comprised of Co.'s gas gathering, processing, and treating operations in the Rocky Mountain region; and Gas and NGL Marketing Services, which includes Co.'s NGL and natural gas marketing and trading operations.

When researching a stock like Williams Cos, many investors are the most familiar with Fundamental Analysis — looking at a company's balance sheet, earnings, revenues, and what's happening in that company's underlying business. Investors who use Fundamental Analysis to identify good stocks to buy or sell can also benefit from WMB Technical Analysis to help find a good entry or exit point. Technical Analysis is blind to the fundamentals and looks only at the trading data for WMB stock — the real life supply and demand for the stock over time — and examines that data in different ways.
10 Most Oversold S&P 500 Stocks
10 Most Overbought S&P 500 Stocks

10 ETFs With Stocks Insiders Are Buying
10 ETFs With Most Upside To Targets
The DividendRank Top 25
Warren Buffett Dividend Stocks
10 Cheap Dividend Stocks Under $10
10 Top DividendRank'ed Energy Stocks
The 10 Highest Yielding Preferred Stocks
The 15 Most Active S&P Call & Put Options
WMB DMAWMB MACD
Video: Technical Analysis


If the video does not load after a few moments, Upgrade to the Latest Flash Player.
Williams Cos (WMB) is categorized under the Energy sector; to help you further research Technical Analysis, below are some other companies in the same sector:

XOM Technical Analysis
APA Technical Analysis
BKR Technical Analysis
COP Technical Analysis
CTRA Technical Analysis
CVX Technical Analysis
DVN Technical Analysis
EOG Technical Analysis
EQT Technical Analysis
FANG Technical Analysis
More Energy companies »


Williams Cos Technical Analysis | www.TechnicalAnalysisChannel.com | Copyright © 2019 - 2024, All Rights Reserved

Nothing in TechnicalAnalysisChannel.com is intended to be investment advice, nor does it represent the opinion of, counsel from, or recommendations by BNK Invest Inc. or any of its affiliates, subsidiaries or partners. None of the information contained herein constitutes a recommendation that any particular security, portfolio, transaction, or investment strategy is suitable for any specific person. All viewers agree that under no circumstances will BNK Invest, Inc,. its subsidiaries, partners, officers, employees, affiliates, or agents be held liable for any loss or damage caused by your reliance on information obtained. By visiting, using or viewing this site, you agree to the following Full Disclaimer & Terms of Use and Privacy Policy. Video widget and market videos powered by Market News Video. Quote and option data delayed at least 15 minutes; stock quote data powered by Ticker Technologies, and Mergent.
X
Wait! Don't leave yet.
Want to receive our latest research absolutely free?


Click the button below for your complimentary copy of Your Early Retirement Portfolio: Dividends Up to 8.7%—Every Month—Forever.

You'll discover the details on 4 stocks and funds that pay you massive dividends as high as 8.7%.