Aptiv is a technology and mobility architecture company primarily serving the automotive sector. Co. designs and manufactures vehicle components and provides electrical, electronic and safety technology solutions. Co.'s business segments are: Signal and Power Solutions, which provides design, manufacture and assembly of the vehicle's electrical architecture, including component products, connectors, wiring assemblies and harnesses, cable management, electrical centers and hybrid high voltage and safety distribution systems; and Advanced Safety and User Experience, which provides technologies, systems integration and software development for vehicle safety, security, comfort and convenience.
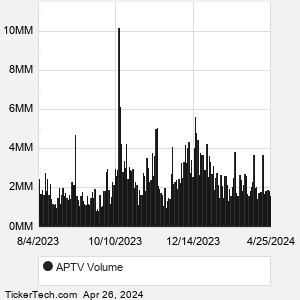
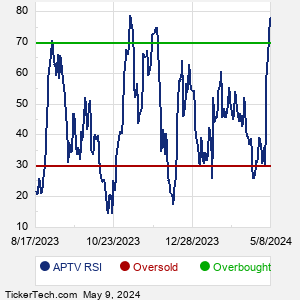
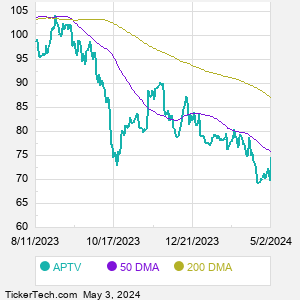
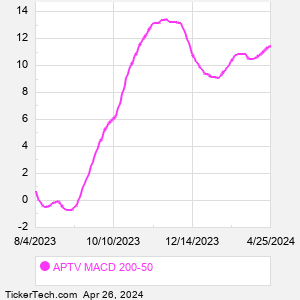
When researching a stock like Aptiv, many investors are the most familiar with Fundamental Analysis — looking at a company's balance sheet, earnings, revenues, and what's happening in that company's underlying business. Investors who use Fundamental Analysis to identify good stocks to buy or sell can also benefit from APTV Technical Analysis to help find a good entry or exit point. Technical Analysis is blind to the fundamentals and looks only at the trading data for APTV stock — the real life supply and demand for the stock over time — and examines that data in different ways. |


 37.77
37.77 Free APTV Email Alerts:






 Video: Technical Analysis