American International Group Technical Analysis


As of date:4/25/2024
AIG stock price:74.63
AIG 50 DMA:74.30
AIG 200 DMA:65.48
AIG MACD (200-50):-8.82
AIG RSI:34.16
Extremely
Overbought
Overbought/Oversold RSI Range
RSI Indicator (Relative Strength Index)34.16
Extremely
Oversold

Also see:
AIG Market Cap History
AIG Shares Outstanding History
AIG YTD Return

Quotes delayed 20 minutes

Email EnvelopeFree AIG Email Alerts:
Get Dividend Alerts
Get SEC Filing Alerts

NLY Crosses Above Key Moving Average Level
7 minutes ago


AMX Makes Bullish Cross Above Critical Moving Average
19 minutes ago


Bullish Two Hundred Day Moving Average Cross - WEYS
27 minutes ago


Primis Financial Corp Breaks Below 200-Day Moving Average - Notable for FRST
38 minutes ago


GSM Crosses Above Key Moving Average Level
38 minutes ago


SPS Commerce Breaks Above 200-Day Moving Average - Bullish for SPSC
39 minutes ago


Lantheus Holdings (LNTH) Shares Cross Above 200 DMA
39 minutes ago


SAIA Crosses Below Key Moving Average Level
44 minutes ago


Eastern Bankshares Breaks Above 200-Day Moving Average - Bullish for EBC
45 minutes ago


HighPeak Energy Breaks Above 200-Day Moving Average - Bullish for HPK
45 minutes ago


KNSL Makes Notable Cross Below Critical Moving Average
1 hour, 20 minutes ago


TS Crosses Critical Technical Indicator
1 hour, 20 minutes ago


Origin Bancorp Inc (OBK) Shares Cross Above 200 DMA
1 hour, 21 minutes ago


SOI Makes Bullish Cross Above Critical Moving Average
1 hour, 21 minutes ago


Farmers & Merchants Bancorp (FMAO) Shares Cross Below 200 DMA
20 hours, 25 minutes ago


More Technical Analysis News

AIG Technical AnalysisAIG RSI
American International Group is a holding company. Through its subsidiaries, Co. is an insurance organization that provides a range of property casualty insurance, life insurance, retirement solutions and other financial services. Co.'s segments include: General Insurance, which provides insurance products and services for commercial and personal insurance customers; Life and Retirement, which brings together a portfolio of life insurance, retirement and institutional products provided through a multichannel distribution network; and Other Operations, which consists businesses held by Co. and other corporate subsidiaries and Co.'s institutional asset management business.

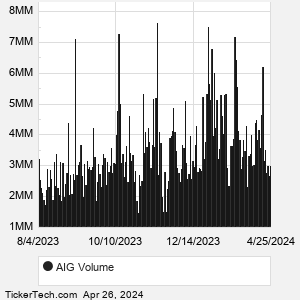
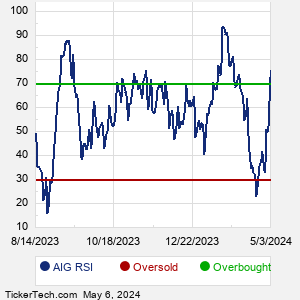
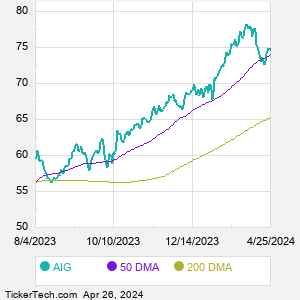
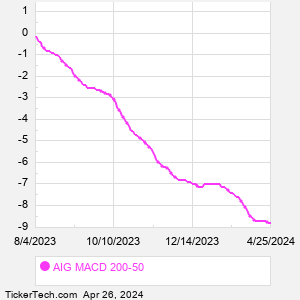
When researching a stock like American International Group, many investors are the most familiar with Fundamental Analysis — looking at a company's balance sheet, earnings, revenues, and what's happening in that company's underlying business. Investors who use Fundamental Analysis to identify good stocks to buy or sell can also benefit from AIG Technical Analysis to help find a good entry or exit point. Technical Analysis is blind to the fundamentals and looks only at the trading data for AIG stock — the real life supply and demand for the stock over time — and examines that data in different ways.
10 Most Oversold S&P 500 Stocks
10 Most Overbought S&P 500 Stocks

10 ETFs With Stocks Insiders Are Buying
10 ETFs With Most Upside To Targets
The DividendRank Top 25
Warren Buffett Dividend Stocks
10 Cheap Dividend Stocks Under $10
10 Top DividendRank'ed Energy Stocks
The 10 Highest Yielding Preferred Stocks
The 15 Most Active S&P Call & Put Options
AIG DMAAIG MACD
Video: Technical Analysis


If the video does not load after a few moments, Upgrade to the Latest Flash Player.
American International Group (AIG) is categorized under the Financials sector; to help you further research Technical Analysis, below are some other companies in the same sector:

AIZ Technical Analysis
AJG Technical Analysis
ALL Technical Analysis
AMP Technical Analysis
AMT Technical Analysis
AON Technical Analysis
ARE Technical Analysis
AVB Technical Analysis
AXP Technical Analysis
BAC Technical Analysis
More Financials companies »


American International Group Technical Analysis | www.TechnicalAnalysisChannel.com | Copyright © 2019 - 2024, All Rights Reserved

Nothing in TechnicalAnalysisChannel.com is intended to be investment advice, nor does it represent the opinion of, counsel from, or recommendations by BNK Invest Inc. or any of its affiliates, subsidiaries or partners. None of the information contained herein constitutes a recommendation that any particular security, portfolio, transaction, or investment strategy is suitable for any specific person. All viewers agree that under no circumstances will BNK Invest, Inc,. its subsidiaries, partners, officers, employees, affiliates, or agents be held liable for any loss or damage caused by your reliance on information obtained. By visiting, using or viewing this site, you agree to the following Full Disclaimer & Terms of Use and Privacy Policy. Video widget and market videos powered by Market News Video. Quote and option data delayed at least 15 minutes; stock quote data powered by Ticker Technologies, and Mergent.
X
Wait! Don't leave yet.
Want to receive our latest research absolutely free?


Click the button below for your complimentary copy of Your Early Retirement Portfolio: Dividends Up to 8.7%—Every Month—Forever.

You'll discover the details on 4 stocks and funds that pay you massive dividends as high as 8.7%.