SYF Technical Analysis


As of date:1/16/2025
SYF stock price:67.81
SYF 50 DMA:65.76
SYF 200 DMA:51.53
SYF MACD (200-50):-14.23
SYF RSI:54.50
Extremely
Overbought
Overbought/Oversold RSI Range
RSI Indicator (Relative Strength Index)54.50
Extremely
Oversold

Also see:
SYF Market Cap History
SYF Shares Outstanding History
SYF YTD Return

Quotes delayed 20 minutes

Email EnvelopeFree SYF Email Alerts:
Get Dividend Alerts
Get SEC Filing Alerts

PLPC Makes Bullish Cross Above Critical Moving Average
1 hour, 27 minutes ago


TXO Crosses Above Key Moving Average Level
1 hour, 32 minutes ago


TD Makes Bullish Cross Above Critical Moving Average
1 hour, 45 minutes ago


TD Makes Bullish Cross Above Critical Moving Average
1 hour, 46 minutes ago


Sun Communities (SUI) Shares Cross Above 200 DMA
1 hour, 58 minutes ago


Bullish Two Hundred Day Moving Average Cross - RLY
1 hour, 58 minutes ago


Snowline Gold Breaks Above 200-Day Moving Average - Bullish for SGD.CA
1 hour, 58 minutes ago


MARA Crosses Above Key Moving Average Level
5 hours, 36 minutes ago


CHX Crosses Above Key Moving Average Level
5 hours, 49 minutes ago


Okta Breaks Above 200-Day Moving Average - Bullish for OKTA
5 hours, 49 minutes ago


CLMT Makes Notable Cross Below Critical Moving Average
5 hours, 53 minutes ago


Credit Acceptance (CACC) Shares Cross Above 200 DMA
6 hours, 17 minutes ago


PCH Makes Bullish Cross Above Critical Moving Average
6 hours, 17 minutes ago


Ferrari Breaks Above 200-Day Moving Average - Bullish for RACE
6 hours, 24 minutes ago


Vontier Breaks Above 200-Day Moving Average - Bullish for VNT
6 hours, 24 minutes ago


More Technical Analysis News

SYF Technical AnalysisSYF RSI
Synchrony Financial is a consumer financial services company focused on delivering digitally enabled product suites. Co. provides a range of credit products through financing programs it has established with a diverse group of national and regional retailers, local merchants, manufacturers, buying groups, industry associations and healthcare service providers. Co. primarily offers private label, dual card, co-brand, and general-purpose credit cards, as well as short- and long-term installment loans, and savings products through Synchrony Bank (the Bank).

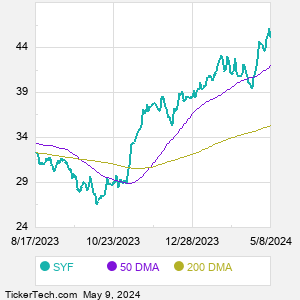
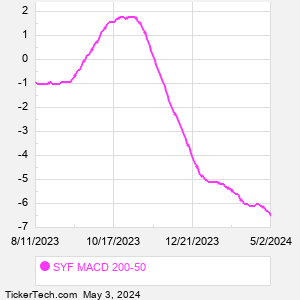
When researching a stock like Synchrony Financial, many investors are the most familiar with Fundamental Analysis — looking at a company's balance sheet, earnings, revenues, and what's happening in that company's underlying business. Investors who use Fundamental Analysis to identify good stocks to buy or sell can also benefit from SYF Technical Analysis to help find a good entry or exit point. Technical Analysis is blind to the fundamentals and looks only at the trading data for SYF stock — the real life supply and demand for the stock over time — and examines that data in different ways.
10 Most Oversold S&P 500 Stocks
10 Most Overbought S&P 500 Stocks

10 ETFs With Stocks Insiders Are Buying
10 ETFs With Most Upside To Targets
The DividendRank Top 25
Warren Buffett Dividend Stocks
10 Cheap Dividend Stocks Under $10
10 Top DividendRank'ed Energy Stocks
The 10 Highest Yielding Preferred Stocks
The 15 Most Active S&P Call & Put Options
SYF DMASYF MACD
Video: Technical Analysis


If the video does not load after a few moments, Upgrade to the Latest Flash Player.
Synchrony Financial (SYF) is categorized under the Financials sector; to help you further research Technical Analysis, below are some other companies in the same sector:

TFC Technical Analysis
TPL Technical Analysis
TROW Technical Analysis
TRV Technical Analysis
UDR Technical Analysis
UNH Technical Analysis
USB Technical Analysis
VICI Technical Analysis
VTR Technical Analysis
WELL Technical Analysis
More Financials companies »


SYF Technical Analysis | www.TechnicalAnalysisChannel.com | Copyright © 2019 - 2025, All Rights Reserved

Nothing in TechnicalAnalysisChannel.com is intended to be investment advice, nor does it represent the opinion of, counsel from, or recommendations by BNK Invest Inc. or any of its affiliates, subsidiaries or partners. None of the information contained herein constitutes a recommendation that any particular security, portfolio, transaction, or investment strategy is suitable for any specific person. All viewers agree that under no circumstances will BNK Invest, Inc,. its subsidiaries, partners, officers, employees, affiliates, or agents be held liable for any loss or damage caused by your reliance on information obtained. By visiting, using or viewing this site, you agree to the following Full Disclaimer & Terms of Use and Privacy Policy. Video widget and market videos powered by Market News Video. Quote and option data delayed at least 15 minutes; stock quote data powered by Ticker Technologies, and Mergent.
X
Wait! Don't leave yet.
Want to receive our latest research absolutely free?


Click the button below for your complimentary copy of Your Early Retirement Portfolio: Dividends Up to 8.3%—Every Month—Forever.

You'll discover the details on 4 stocks and funds that pay you massive dividends as high as 8.3%.