USB Technical Analysis


As of date:4/25/2024
USB stock price:40.99
USB 50 DMA:41.98
USB 200 DMA:37.97
USB MACD (200-50):-4.01
USB RSI:37.80
Extremely
Overbought
Overbought/Oversold RSI Range
RSI Indicator (Relative Strength Index)37.80
Extremely
Oversold

Also see:
USB Market Cap History
USB Shares Outstanding History
USB YTD Return

Quotes delayed 20 minutes

Email EnvelopeFree USB Email Alerts:
Get Dividend Alerts
Get SEC Filing Alerts

Noah Holdings (NOAH) Shares Cross Above 200 DMA
1 hour, 43 minutes ago


Shares of SHM Now Oversold
1 hour, 44 minutes ago


Notable Two Hundred Day Moving Average Cross - CNC
1 hour, 44 minutes ago


TS Makes Notable Cross Below Critical Moving Average
1 hour, 44 minutes ago


PAG Crosses Above Key Moving Average Level
1 hour, 45 minutes ago


Adtalem Global Education Breaks Above 200-Day Moving Average - Bullish for ATGE
1 hour, 45 minutes ago


NEU Crosses Below Key Moving Average Level
2 hour ago


Trican Well Service Crosses Above Key Moving Average Level
2 hours, 5 minutes ago


Bonterra Energy Corp Shares Cross Below 200 DMA
2 hours, 8 minutes ago


Bullish Two Hundred Day Moving Average Cross - Canadian Banc
2 hours, 13 minutes ago


SPDR S&P China (GXC) Shares Cross Above 200 DMA
3 hours, 46 minutes ago


SDIV Makes Bullish Cross Above Critical Moving Average
3 hours, 47 minutes ago


Bullish Two Hundred Day Moving Average Cross - IDA
3 hours, 54 minutes ago


Notable Two Hundred Day Moving Average Cross - WKC
4 hours, 6 minutes ago


DOC Crosses Above Key Moving Average Level
4 hours, 16 minutes ago


More Technical Analysis News

USB Technical AnalysisUSB RSI
U.S. Bancorp is a financial services holding company. Through its subsidiaries, Co. provides a range of financial services, including lending and depository services, cash management, capital markets, and trust and investment management services. Co. also engages in credit card services, merchant and ATM processing, mortgage banking, insurance, brokerage and leasing. Co.'s banking subsidiary, U.S. Bank National Association, is engaged in the general banking business, principally in domestic markets. Co.'s bank and trust subsidiaries provide a range of asset management and fiduciary services for individuals, estates, foundations, business corporations and charitable organizations.

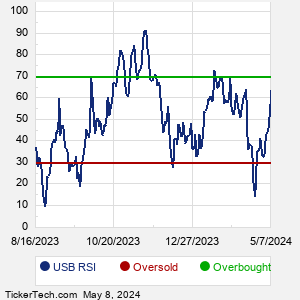
When researching a stock like US Bancorp, many investors are the most familiar with Fundamental Analysis — looking at a company's balance sheet, earnings, revenues, and what's happening in that company's underlying business. Investors who use Fundamental Analysis to identify good stocks to buy or sell can also benefit from USB Technical Analysis to help find a good entry or exit point. Technical Analysis is blind to the fundamentals and looks only at the trading data for USB stock — the real life supply and demand for the stock over time — and examines that data in different ways.
10 Most Oversold S&P 500 Stocks
10 Most Overbought S&P 500 Stocks

10 ETFs With Stocks Insiders Are Buying
10 ETFs With Most Upside To Targets
The DividendRank Top 25
Warren Buffett Dividend Stocks
10 Cheap Dividend Stocks Under $10
10 Top DividendRank'ed Energy Stocks
The 10 Highest Yielding Preferred Stocks
The 15 Most Active S&P Call & Put Options
USB DMAUSB MACD
Video: Technical Analysis


If the video does not load after a few moments, Upgrade to the Latest Flash Player.
US Bancorp (USB) is categorized under the Financials sector; to help you further research Technical Analysis, below are some other companies in the same sector:

VICI Technical Analysis
VTR Technical Analysis
WELL Technical Analysis
WFC Technical Analysis
WRB Technical Analysis
WY Technical Analysis
ACGL Technical Analysis
AFL Technical Analysis
AIG Technical Analysis
AIZ Technical Analysis
More Financials companies »


USB Technical Analysis | www.TechnicalAnalysisChannel.com | Copyright © 2019 - 2024, All Rights Reserved

Nothing in TechnicalAnalysisChannel.com is intended to be investment advice, nor does it represent the opinion of, counsel from, or recommendations by BNK Invest Inc. or any of its affiliates, subsidiaries or partners. None of the information contained herein constitutes a recommendation that any particular security, portfolio, transaction, or investment strategy is suitable for any specific person. All viewers agree that under no circumstances will BNK Invest, Inc,. its subsidiaries, partners, officers, employees, affiliates, or agents be held liable for any loss or damage caused by your reliance on information obtained. By visiting, using or viewing this site, you agree to the following Full Disclaimer & Terms of Use and Privacy Policy. Video widget and market videos powered by Market News Video. Quote and option data delayed at least 15 minutes; stock quote data powered by Ticker Technologies, and Mergent.
X
Wait! Don't leave yet.
Want to receive our latest research absolutely free?


Click the button below for your complimentary copy of Your Early Retirement Portfolio: Dividends Up to 8.7%—Every Month—Forever.

You'll discover the details on 4 stocks and funds that pay you massive dividends as high as 8.7%.