Honeywell International Technical Analysis


As of date:4/25/2024
HON stock price:193.02
HON 50 DMA:197.85
HON 200 DMA:193.30
HON MACD (200-50):-4.55
HON RSI:40.02
Extremely
Overbought
Overbought/Oversold RSI Range
RSI Indicator (Relative Strength Index)40.02
Extremely
Oversold

Also see:
HON Market Cap History
HON Shares Outstanding History
HON YTD Return

Quotes delayed 20 minutes

Email EnvelopeFree HON Email Alerts:
Get Dividend Alerts
Get SEC Filing Alerts

Noah Holdings (NOAH) Shares Cross Above 200 DMA
1 hour, 23 minutes ago


Shares of SHM Now Oversold
1 hour, 24 minutes ago


Notable Two Hundred Day Moving Average Cross - CNC
1 hour, 24 minutes ago


TS Makes Notable Cross Below Critical Moving Average
1 hour, 24 minutes ago


PAG Crosses Above Key Moving Average Level
1 hour, 25 minutes ago


Adtalem Global Education Breaks Above 200-Day Moving Average - Bullish for ATGE
1 hour, 25 minutes ago


NEU Crosses Below Key Moving Average Level
1 hour, 40 minutes ago


Trican Well Service Crosses Above Key Moving Average Level
1 hour, 45 minutes ago


Bonterra Energy Corp Shares Cross Below 200 DMA
1 hour, 48 minutes ago


Bullish Two Hundred Day Moving Average Cross - Canadian Banc
1 hour, 53 minutes ago


SPDR S&P China (GXC) Shares Cross Above 200 DMA
3 hours, 26 minutes ago


SDIV Makes Bullish Cross Above Critical Moving Average
3 hours, 27 minutes ago


Bullish Two Hundred Day Moving Average Cross - IDA
3 hours, 34 minutes ago


Notable Two Hundred Day Moving Average Cross - WKC
3 hours, 46 minutes ago


DOC Crosses Above Key Moving Average Level
3 hours, 56 minutes ago


More Technical Analysis News

HON Technical AnalysisHON RSI
Honeywell International is a technology and manufacturing company. Co. has four segments: Aerospace, which supplies products, software and services for aircrafts; Honeywell Building Technologies, which provides products, software, solutions and technologies including building control and optimization, energy management, access control, video surveillance, fire products, and remote patient monitoring systems; Performance Materials and Technologies, which develops and manufactures chemicals and materials, process technologies and automation solutions; and Safety and Productivity Solutions, which provides products and software that improve productivity, workplace safety and asset performance.

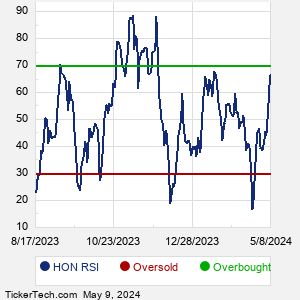
When researching a stock like Honeywell International, many investors are the most familiar with Fundamental Analysis — looking at a company's balance sheet, earnings, revenues, and what's happening in that company's underlying business. Investors who use Fundamental Analysis to identify good stocks to buy or sell can also benefit from HON Technical Analysis to help find a good entry or exit point. Technical Analysis is blind to the fundamentals and looks only at the trading data for HON stock — the real life supply and demand for the stock over time — and examines that data in different ways.
10 Most Oversold S&P 500 Stocks
10 Most Overbought S&P 500 Stocks

10 ETFs With Stocks Insiders Are Buying
10 ETFs With Most Upside To Targets
The DividendRank Top 25
Warren Buffett Dividend Stocks
10 Cheap Dividend Stocks Under $10
10 Top DividendRank'ed Energy Stocks
The 10 Highest Yielding Preferred Stocks
The 15 Most Active S&P Call & Put Options
HON DMAHON MACD
Video: Technical Analysis


If the video does not load after a few moments, Upgrade to the Latest Flash Player.
Honeywell International (HON) is categorized under the Consumer sector; to help you further research Technical Analysis, below are some other companies in the same sector:

HRL Technical Analysis
HSY Technical Analysis
JCI Technical Analysis
K Technical Analysis
KDP Technical Analysis
KHC Technical Analysis
KMB Technical Analysis
KO Technical Analysis
LKQ Technical Analysis
LW Technical Analysis
More Consumer companies »


Honeywell International Technical Analysis | www.TechnicalAnalysisChannel.com | Copyright © 2019 - 2024, All Rights Reserved

Nothing in TechnicalAnalysisChannel.com is intended to be investment advice, nor does it represent the opinion of, counsel from, or recommendations by BNK Invest Inc. or any of its affiliates, subsidiaries or partners. None of the information contained herein constitutes a recommendation that any particular security, portfolio, transaction, or investment strategy is suitable for any specific person. All viewers agree that under no circumstances will BNK Invest, Inc,. its subsidiaries, partners, officers, employees, affiliates, or agents be held liable for any loss or damage caused by your reliance on information obtained. By visiting, using or viewing this site, you agree to the following Full Disclaimer & Terms of Use and Privacy Policy. Video widget and market videos powered by Market News Video. Quote and option data delayed at least 15 minutes; stock quote data powered by Ticker Technologies, and Mergent.
X
Wait! Don't leave yet.
Want to receive our latest research absolutely free?


Click the button below for your complimentary copy of Your Early Retirement Portfolio: Dividends Up to 8.7%—Every Month—Forever.

You'll discover the details on 4 stocks and funds that pay you massive dividends as high as 8.7%.