K Technical Analysis


As of date:2/6/2025
K stock price:82.13
K 50 DMA:81.13
K 200 DMA:71.97
K MACD (200-50):-9.16
K RSI:67.07
Extremely
Overbought
Overbought/Oversold RSI Range
RSI Indicator (Relative Strength Index)67.07
Extremely
Oversold

Also see:
K Market Cap History
K Shares Outstanding History
K YTD Return

Quotes delayed 20 minutes

Email EnvelopeFree K Email Alerts:
Get Dividend Alerts
Get SEC Filing Alerts

Virtus Newfleet Multi-Sector Bond Breaks Below 200-Day Moving Average - Notable for NFLT
45 minutes ago


Notable Two Hundred Day Moving Average Cross - SPRY
55 minutes ago


VITL Makes Notable Cross Below Critical Moving Average
56 minutes ago


AvidXchange Holdings Breaks Below 200-Day Moving Average - Notable for AVDX
56 minutes ago


ProPetro Holding Breaks Below 200-Day Moving Average - Notable for PUMP
1 hour, 4 minutes ago


PFG Crosses Above Key Moving Average Level
1 hour, 6 minutes ago


Rivernorth Opportunities Fund Breaks Above 200-Day Moving Average - Bullish for RIV
1 hour, 6 minutes ago


MRC Global Breaks Below 200-Day Moving Average - Notable for MRC
1 hour, 6 minutes ago


ENS Makes Bullish Cross Above Critical Moving Average
1 hour, 6 minutes ago


Notable Two Hundred Day Moving Average Cross - BUI
1 hour, 6 minutes ago


Ingevity (NGVT) Shares Cross Below 200 DMA
1 hour, 6 minutes ago


WST Crosses Below Key Moving Average Level
1 hour, 7 minutes ago


JSCP Makes Notable Cross Below Critical Moving Average
1 hour, 7 minutes ago


Skechers USA Breaks Below 200-Day Moving Average - Notable for SKX
1 hour, 7 minutes ago


PCVX Makes Notable Cross Below Critical Moving Average
1 hour, 10 minutes ago


More Technical Analysis News

K Technical AnalysisK RSI
Kellanova is engaged in manufacturing and marketing of snacks and convenience foods. Co.'s segments include North America, Europe, Latin America, and AMEA (Asia Middle East Africa). Its principal products are snacks, such as crackers, savory snacks, toaster pastries, cereal bars, granola bars and bites, and convenience foods, such as, ready-to-eat cereals, frozen waffles, veggie foods and noodles. Its snacks brands are marketed under brands such as Kellogg's, Cheez-It, Pringles, Austin, Parati, and RXBAR. Its frozen foods are marketed under the Eggo and Morningstar Farms brands.

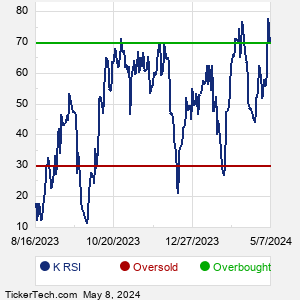
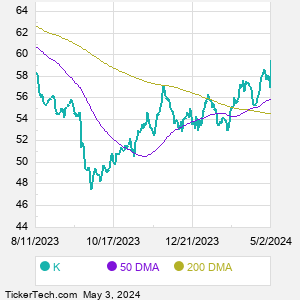
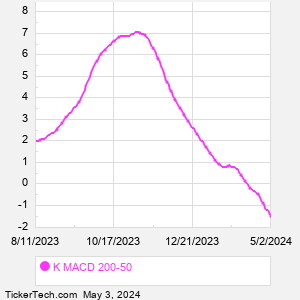
When researching a stock like Kellogg, many investors are the most familiar with Fundamental Analysis — looking at a company's balance sheet, earnings, revenues, and what's happening in that company's underlying business. Investors who use Fundamental Analysis to identify good stocks to buy or sell can also benefit from K Technical Analysis to help find a good entry or exit point. Technical Analysis is blind to the fundamentals and looks only at the trading data for K stock — the real life supply and demand for the stock over time — and examines that data in different ways.
10 Most Oversold S&P 500 Stocks
10 Most Overbought S&P 500 Stocks

10 ETFs With Stocks Insiders Are Buying
10 ETFs With Most Upside To Targets
The DividendRank Top 25
Warren Buffett Dividend Stocks
10 Cheap Dividend Stocks Under $10
10 Top DividendRank'ed Energy Stocks
The 10 Highest Yielding Preferred Stocks
The 15 Most Active S&P Call & Put Options
K DMAK MACD
Video: Technical Analysis


If the video does not load after a few moments, Upgrade to the Latest Flash Player.
Kellogg (K) is categorized under the Consumer sector; to help you further research Technical Analysis, below are some other companies in the same sector:

KDP Technical Analysis
KHC Technical Analysis
KMB Technical Analysis
KO Technical Analysis
LKQ Technical Analysis
LW Technical Analysis
MDLZ Technical Analysis
MKC Technical Analysis
MNST Technical Analysis
MO Technical Analysis
More Consumer companies »


K Technical Analysis | www.TechnicalAnalysisChannel.com | Copyright © 2019 - 2025, All Rights Reserved

Nothing in TechnicalAnalysisChannel.com is intended to be investment advice, nor does it represent the opinion of, counsel from, or recommendations by BNK Invest Inc. or any of its affiliates, subsidiaries or partners. None of the information contained herein constitutes a recommendation that any particular security, portfolio, transaction, or investment strategy is suitable for any specific person. All viewers agree that under no circumstances will BNK Invest, Inc,. its subsidiaries, partners, officers, employees, affiliates, or agents be held liable for any loss or damage caused by your reliance on information obtained. By visiting, using or viewing this site, you agree to the following Full Disclaimer & Terms of Use and Privacy Policy. Video widget and market videos powered by Market News Video. Quote and option data delayed at least 15 minutes; stock quote data powered by Ticker Technologies, and Mergent.
X
Wait! Don't leave yet.
Want to receive our latest research absolutely free?


Click the button below for your complimentary copy of Your Early Retirement Portfolio: Dividends Up to 8.3%—Every Month—Forever.

You'll discover the details on 4 stocks and funds that pay you massive dividends as high as 8.3%.