PG Technical Analysis


As of date:4/15/2026
PG stock price:143.38
PG 50 DMA:152.55
PG 200 DMA:150.21
PG MACD (200-50):-2.34
PG RSI:48.45
Extremely
Overbought
Overbought/Oversold RSI Range
RSI Indicator (Relative Strength Index)48.45
Extremely
Oversold

Also see:
PG Market Cap History
PG Shares Outstanding History
PG YTD Return

Quotes delayed 20 minutes

Email EnvelopeFree PG Email Alerts:
Get Dividend Alerts
Get SEC Filing Alerts

MPLX Enters Oversold Territory as RSI Falls Below 30
20 hours, 56 minutes ago


Direxion Daily AI and Big Data Bear 2X Shares ETF Enters Oversold Territory
20 hours, 56 minutes ago


BRP Stock Enters Oversold Territory as RSI Falls to 24.5
21 hours, 2 minutes ago


BRP Stock Enters Oversold Territory as Dividend Investors Reassess DOO
22 hours, 4 minutes ago


AGF Management Stock Enters Oversold Zone as RSI Falls Below 30
Tuesday, April 14, 4:36 PM


Expand Energy Stock Flashes Oversold RSI Signal as Selling Pressure Mounts (EXE)
Tuesday, April 14, 4:28 PM


DAMD ETF Enters Oversold Territory As Short AMD Trade Unwinds
Tuesday, April 14, 4:23 PM


AGF Management Shares Top 3 Percent Dividend Yield as Price Pulls Back
Tuesday, April 14, 4:21 PM


Comstock Resources Stock Enters Oversold Zone as RSI Drops Below 30
Tuesday, April 14, 4:14 PM


ETF Asset Flows: Capital Group Dividend Value Sees Fresh Inflows as Key Holdings Advance
Tuesday, April 14, 11:02 AM


NNN REIT Joins SAFE 25 List With 5.5% Yield And Decades Of Dividend Growth
Tuesday, April 14, 7:31 AM


Accenture Dividend Analysis Why ACN Is A Core Holding For Income Investors
Tuesday, April 14, 7:30 AM


HDLB Enters Oversold Territory As Dividend ETN Faces Sharp Selloff
Monday, April 13, 4:13 PM


Black Stone Minerals Stock Enters Oversold Zone As RSI Signals Potential Rebound
Monday, April 13, 4:01 PM


Conagra Brands RSI Signals Oversold Conditions And Elevated Dividend Yield
Monday, April 13, 4:01 PM


More Technical Analysis News

PG Technical AnalysisPG RSI
The Procter & Gamble Co. is focused on providing branded consumer packaged goods to consumers across the world. Co.'s segments include Beauty, Grooming, Health Care, Fabric & Home Care and Baby, Feminine & Family Care. Co.'s products are sold in approximately 180 countries and territories primarily through mass merchandisers, e-commerce, including social commerce channels, grocery stores, membership club stores, drug stores, department stores, distributors, wholesalers, specialty beauty stores, including airport duty-free stores), high-frequency stores, pharmacies, electronics stores and professional channels. It also sells direct to individual consumers.

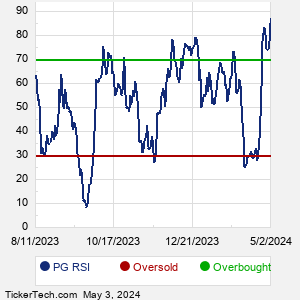
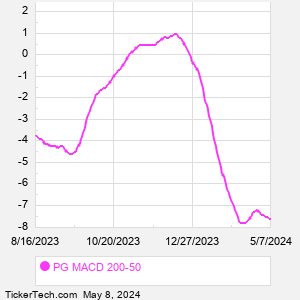
When researching a stock like Procter and Gamble, many investors are the most familiar with Fundamental Analysis — looking at a company's balance sheet, earnings, revenues, and what's happening in that company's underlying business. Investors who use Fundamental Analysis to identify good stocks to buy or sell can also benefit from PG Technical Analysis to help find a good entry or exit point. Technical Analysis is blind to the fundamentals and looks only at the trading data for PG stock — the real life supply and demand for the stock over time — and examines that data in different ways.
10 Most Oversold S&P 500 Stocks
10 Most Overbought S&P 500 Stocks

10 ETFs With Stocks Insiders Are Buying
10 ETFs With Most Upside To Targets
The DividendRank Top 25
Warren Buffett Dividend Stocks
10 Cheap Dividend Stocks Under $10
10 Top DividendRank'ed Energy Stocks
The 10 Highest Yielding Preferred Stocks
The 15 Most Active S&P Call & Put Options
PG DMAPG MACD
Video: Technical Analysis
Procter and Gamble (PG) is categorized under the Consumer sector; to help you further research Technical Analysis, below are some other companies in the same sector:

PM Technical Analysis
POOL Technical Analysis
RCL Technical Analysis
RL Technical Analysis
SJM Technical Analysis
STZ Technical Analysis
TAP Technical Analysis
TPR Technical Analysis
TSLA Technical Analysis
TSN Technical Analysis
More Consumer companies »
 

PG Technical Analysis | www.TechnicalAnalysisChannel.com | Copyright © 2019 - 2026, All Rights Reserved

Nothing in TechnicalAnalysisChannel.com is intended to be investment advice, nor does it represent the opinion of, counsel from, or recommendations by BNK Invest Inc. or any of its affiliates, subsidiaries or partners. None of the information contained herein constitutes a recommendation that any particular security, portfolio, transaction, or investment strategy is suitable for any specific person. All viewers agree that under no circumstances will BNK Invest, Inc,. its subsidiaries, partners, officers, employees, affiliates, or agents be held liable for any loss or damage caused by your reliance on information obtained. By visiting, using or viewing this site, you agree to the following Full Disclaimer & Terms of Use and Privacy Policy. Video widget and market videos powered by Market News Video. Quote and option data delayed at least 15 minutes; stock quote data powered by Ticker Technologies, and Mergent.
X
Wait! Don't leave yet.
Want to receive our latest research absolutely free?


Click the button below for your complimentary copy of Your Early Retirement Portfolio: Dividends Up to 8.2%—Every Month—Forever.

You'll discover the details on 4 stocks and funds that pay you massive dividends as high as 8.2%.