Phillips 66 Technical Analysis


As of date:4/25/2024
PSX stock price:157.24
PSX 50 DMA:155.04
PSX 200 DMA:128.05
PSX MACD (200-50):-26.99
PSX RSI:23.06
Extremely
Overbought
Overbought/Oversold RSI Range
RSI Indicator (Relative Strength Index)23.06
Extremely
Oversold

Also see:
PSX Market Cap History
PSX Shares Outstanding History
PSX YTD Return

Quotes delayed 20 minutes

Email EnvelopeFree PSX Email Alerts:
Get Dividend Alerts
Get SEC Filing Alerts

SPDR S&P China (GXC) Shares Cross Above 200 DMA
16 minutes ago


SDIV Makes Bullish Cross Above Critical Moving Average
17 minutes ago


Bullish Two Hundred Day Moving Average Cross - IDA
24 minutes ago


Notable Two Hundred Day Moving Average Cross - WKC
36 minutes ago


DOC Crosses Above Key Moving Average Level
46 minutes ago


TEX Crosses Below Key Moving Average Level
1 hour, 32 minutes ago


Vanguard Global ex-U.S. Real Estate Breaks Above 200-Day Moving Average - Bullish for VNQI
1 hour, 33 minutes ago


MCHI Makes Bullish Cross Above Critical Moving Average
1 hour, 34 minutes ago


TFII Crosses Below Key Moving Average Level
1 hour, 34 minutes ago


EIG Makes Notable Cross Below Critical Moving Average
1 hour, 38 minutes ago


Vipshop Holdings Breaks Above 200-Day Moving Average - Bullish for VIPS
1 hour, 39 minutes ago


TNET Makes Notable Cross Below Critical Moving Average
1 hour, 39 minutes ago


NLY Crosses Above Key Moving Average Level
1 hour, 47 minutes ago


AMX Makes Bullish Cross Above Critical Moving Average
1 hour, 59 minutes ago


Bullish Two Hundred Day Moving Average Cross - WEYS
2 hours, 7 minutes ago


More Technical Analysis News

PSX Technical AnalysisPSX RSI
Phillips 66 is an energy manufacturing and logistics company with midstream, chemicals, refining, and marketing and specialties businesses. Co.'s segments include: Midstream, which provides crude oil and refined petroleum product transportation, terminaling and processing services, as well as natural gas and natural gas liquids transportation, storage, processing and marketing services; Chemicals, which manufactures and markets petrochemicals and plastics on a worldwide basis; Refining, which refines crude oil and other feedstocks into petroleum products; and Marketing and Specialties, which purchases for resale and markets refined petroleum products, mainly in the U.S. and Europe.

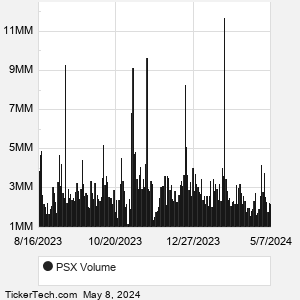
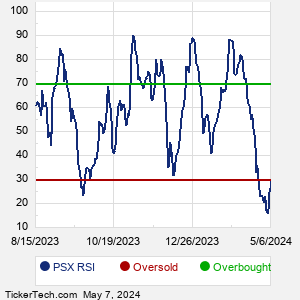
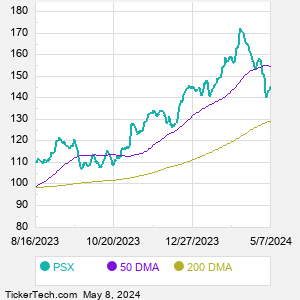
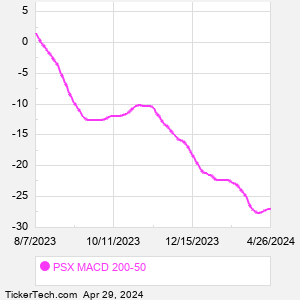
When researching a stock like Phillips 66, many investors are the most familiar with Fundamental Analysis — looking at a company's balance sheet, earnings, revenues, and what's happening in that company's underlying business. Investors who use Fundamental Analysis to identify good stocks to buy or sell can also benefit from PSX Technical Analysis to help find a good entry or exit point. Technical Analysis is blind to the fundamentals and looks only at the trading data for PSX stock — the real life supply and demand for the stock over time — and examines that data in different ways.
10 Most Oversold S&P 500 Stocks
10 Most Overbought S&P 500 Stocks

10 ETFs With Stocks Insiders Are Buying
10 ETFs With Most Upside To Targets
The DividendRank Top 25
Warren Buffett Dividend Stocks
10 Cheap Dividend Stocks Under $10
10 Top DividendRank'ed Energy Stocks
The 10 Highest Yielding Preferred Stocks
The 15 Most Active S&P Call & Put Options
PSX DMAPSX MACD
Video: Technical Analysis


If the video does not load after a few moments, Upgrade to the Latest Flash Player.
Phillips 66 (PSX) is categorized under the Energy sector; to help you further research Technical Analysis, below are some other companies in the same sector:

PXD Technical Analysis
SLB Technical Analysis
TRGP Technical Analysis
TT Technical Analysis
VLO Technical Analysis
WMB Technical Analysis
XOM Technical Analysis
APA Technical Analysis
BKR Technical Analysis
COP Technical Analysis
More Energy companies »


Phillips 66 Technical Analysis | www.TechnicalAnalysisChannel.com | Copyright © 2019 - 2024, All Rights Reserved

Nothing in TechnicalAnalysisChannel.com is intended to be investment advice, nor does it represent the opinion of, counsel from, or recommendations by BNK Invest Inc. or any of its affiliates, subsidiaries or partners. None of the information contained herein constitutes a recommendation that any particular security, portfolio, transaction, or investment strategy is suitable for any specific person. All viewers agree that under no circumstances will BNK Invest, Inc,. its subsidiaries, partners, officers, employees, affiliates, or agents be held liable for any loss or damage caused by your reliance on information obtained. By visiting, using or viewing this site, you agree to the following Full Disclaimer & Terms of Use and Privacy Policy. Video widget and market videos powered by Market News Video. Quote and option data delayed at least 15 minutes; stock quote data powered by Ticker Technologies, and Mergent.
X
Wait! Don't leave yet.
Want to receive our latest research absolutely free?


Click the button below for your complimentary copy of Your Early Retirement Portfolio: Dividends Up to 8.7%—Every Month—Forever.

You'll discover the details on 4 stocks and funds that pay you massive dividends as high as 8.7%.