Simon Property Group Technical Analysis


As of date:4/24/2024
SPG stock price:142.81
SPG 50 DMA:148.27
SPG 200 DMA:126.83
SPG MACD (200-50):-21.44
SPG RSI:37.51
Extremely
Overbought
Overbought/Oversold RSI Range
RSI Indicator (Relative Strength Index)37.51
Extremely
Oversold

Also see:
SPG Market Cap History
SPG Shares Outstanding History
SPG YTD Return

Quotes delayed 20 minutes

Email EnvelopeFree SPG Email Alerts:
Get Dividend Alerts
Get SEC Filing Alerts

Farmers & Merchants Bancorp (FMAO) Shares Cross Below 200 DMA
1 hour, 35 minutes ago


Plexus (PLXS) Shares Cross Above 200 DMA
1 hour, 40 minutes ago


HBI Crosses Below Key Moving Average Level
1 hour, 49 minutes ago


VTES Crosses Critical Technical Indicator
1 hour, 50 minutes ago


MVT Crosses Below Key Moving Average Level
1 hour, 57 minutes ago


Putnam Managed Municipal Income Trust (PMM) Shares Cross Below 200 DMA
2 hour ago


iShares CMBS Breaks Below 200-Day Moving Average - Notable for CMBS
2 hours ago


MCAN Mortgage Crosses Above Key Moving Average Level
2 hours, 7 minutes ago


Mineralys Therapeutics Breaks Below 200-Day Moving Average - Notable for MLYS
4 hours, 34 minutes ago


Day One Biopharmaceuticals (DAWN) Shares Cross Below 200 DMA
4 hours, 34 minutes ago


Arvinas (ARVN) Shares Cross Below 200 DMA
5 hours, 23 minutes ago


OPRA Crosses Below Key Moving Average Level
5 hours, 24 minutes ago


DCPH Makes Notable Cross Below Critical Moving Average
5 hours, 24 minutes ago


FENC Makes Notable Cross Below Critical Moving Average
5 hours, 24 minutes ago


SVRA Makes Notable Cross Below Critical Moving Average
5 hours, 24 minutes ago


More Technical Analysis News

SPG Technical AnalysisSPG RSI
Simon Property Group operates as a self-administered and self-managed real estate investment trust. Simon Property Group, L.P. is Co.'s majority-owned Delaware partnership subsidiary that owns all of its real estate properties and other assets. Co. owns, develops and manages shopping, dining, entertainment and mixed-use destinations. Co. owns or holds an interest in various income-producing properties in the U.S., which consisted of malls, Premium Outlets, Mills, lifestyle centers, and other retail properties in various states and Puerto Rico. Internationally, Co. has ownership interests in Premium Outlets and Designer Outlet properties primarily located in Asia, Europe and Canada.

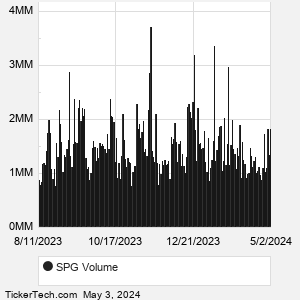
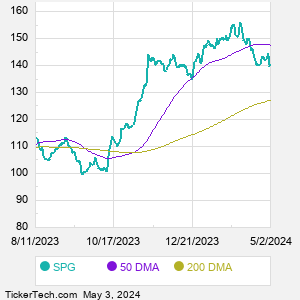
When researching a stock like Simon Property Group, many investors are the most familiar with Fundamental Analysis — looking at a company's balance sheet, earnings, revenues, and what's happening in that company's underlying business. Investors who use Fundamental Analysis to identify good stocks to buy or sell can also benefit from SPG Technical Analysis to help find a good entry or exit point. Technical Analysis is blind to the fundamentals and looks only at the trading data for SPG stock — the real life supply and demand for the stock over time — and examines that data in different ways.
10 Most Oversold S&P 500 Stocks
10 Most Overbought S&P 500 Stocks

10 ETFs With Stocks Insiders Are Buying
10 ETFs With Most Upside To Targets
The DividendRank Top 25
Warren Buffett Dividend Stocks
10 Cheap Dividend Stocks Under $10
10 Top DividendRank'ed Energy Stocks
The 10 Highest Yielding Preferred Stocks
The 15 Most Active S&P Call & Put Options
SPG DMASPG MACD
Video: Technical Analysis


If the video does not load after a few moments, Upgrade to the Latest Flash Player.
Simon Property Group (SPG) is categorized under the Financials sector; to help you further research Technical Analysis, below are some other companies in the same sector:

SPGI Technical Analysis
STT Technical Analysis
SYF Technical Analysis
TFC Technical Analysis
TROW Technical Analysis
TRV Technical Analysis
UDR Technical Analysis
UNH Technical Analysis
USB Technical Analysis
VICI Technical Analysis
More Financials companies »


Simon Property Group Technical Analysis | www.TechnicalAnalysisChannel.com | Copyright © 2019 - 2024, All Rights Reserved

Nothing in TechnicalAnalysisChannel.com is intended to be investment advice, nor does it represent the opinion of, counsel from, or recommendations by BNK Invest Inc. or any of its affiliates, subsidiaries or partners. None of the information contained herein constitutes a recommendation that any particular security, portfolio, transaction, or investment strategy is suitable for any specific person. All viewers agree that under no circumstances will BNK Invest, Inc,. its subsidiaries, partners, officers, employees, affiliates, or agents be held liable for any loss or damage caused by your reliance on information obtained. By visiting, using or viewing this site, you agree to the following Full Disclaimer & Terms of Use and Privacy Policy. Video widget and market videos powered by Market News Video. Quote and option data delayed at least 15 minutes; stock quote data powered by Ticker Technologies, and Mergent.
X
Wait! Don't leave yet.
Want to receive our latest research absolutely free?


Click the button below for your complimentary copy of Your Early Retirement Portfolio: Dividends Up to 8.7%—Every Month—Forever.

You'll discover the details on 4 stocks and funds that pay you massive dividends as high as 8.7%.